
Fig. 1.
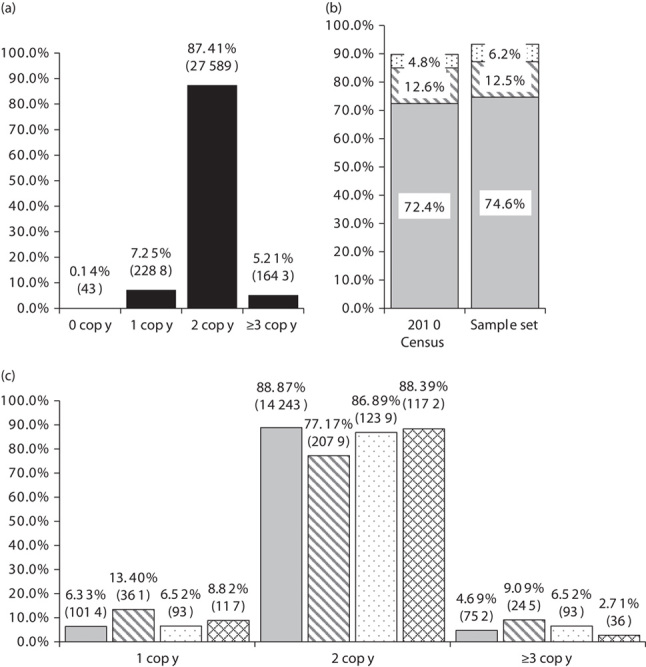
Distribution of samples containing zero, one, two, and three or more copies of the CYP2D6 gene. (a) Percentages of samples containing zero, one, two, and three or more copies of the CYP2D6 gene throughout the entire sample set (n=31 563), actual sample numbers in parentheses. (b) Percentages of self-reported ethnicity in the US 2010 Census as compared with the selected sample set, Caucasians (light grey), African Americans (diagonal lines), and Asians (dots). (c) Percentages of samples containing one, two, and three or more copies of the CYP2D6 gene stratified based on self-reported ethnicity (n=21 472), actual sample numbers in parentheses, Caucasians (light grey), African Americans (diagonal lines), Asians (dots), and Hispanics (diamonds).