Abstract
The overall one-photon two-electron peroxide-to-dioxygen oxidation chemistry (O22− + 1 hν → O2 + 2e−) was achieved with copper complexes. Interestingly, light excitation of peroxo dinuclear copper(II) complexes with an μ-η2-η2–(side-on) peroxo ligation was found to release dioxygen while those with a trans-1,2 (end-on) geometry did not, even though spectroscopic studies revealed that both reactions proceeded through superoxo intermediates. More specifically, femtosecond laser excitation of acetone solutions of a trans-μ–1,2(end-on) peroxo dinuclear copper(II) complex ([(tmpa)2CuII2(O2)]2+ (1); λmax, 525 & 600 nm) and μ-η2-η2–(side-on) peroxo dinuclear copper(II) complexes ([(N5)CuII2(O2)]2+ (2) and [(N3)CuII2(O2)]2+ (3)) at −80 °C resulted in the rapid formation of an intermediate that was reasonably assigned to be a previously unknown mixed-valent superoxide species, [CuII(O2•−)CuI]2+ (λmax, 685–740 nm). For 1, this intermediate underwent further fast intramolecular electron transfer from the O2•− moiety to the CuII ion to yield an ‘O2-caged’ dicopper(I) adduct, CuI2–O2, with rate constant of (2.8 ± 0.4) × 1012 s−1 but without release of O2. Instead, data consistent with barrierless stepwise back electron transfer to regenerate 1 were observed with the rate constant (1.8 ± 0.1) × 1010 s−1. Femtosecond laser excitation of the side-on peroxide complexes 2 and 3 under the same conditions led to the appearance of transient species well formulated as [CuII(O2•−)CuI]2+ intermediates that underwent further intramolecular electron-transfer from the O2•− center to the CuII ion resulting in complete O2 release to produce the corresponding dicopper(I) compounds with rate constants of (3.9 ± 0.3) × 109 s−1 and (7.3 ± 0.3) × 109 s−1 for 2 and 3, respectively. Such remarkable differences in reaction pathways for the peroxo dinuclear copper(II) complexes likely result from the ligand-derived stability of the CuI vs CuII species (such as the CuII2–O2 intermediates); N5 and N3 CuI complexes are far more stable than tmpa-CuI species, as known from measured ligand-CuII/I redox potentials. With the evolution of O2 upon laser excitation of 2 and 3, we could also then measure the very fast overall CuI2/O2 re-binding kinetics using nanosecond laser spectroscopy. The results closely track those known for the dicopper proteins hemocyanin and tyrosinase, for which the synthetic dicopper(I) precursors [(N5)CuI2]2+ and [(N3)CuI2]2+ and their dioxygen adducts serve as models. The biological relevance of the present findings is discussed, including the potential impact on the solar water splitting process.
Introduction
Copper-dioxygen intermediates play key roles in chemically mediated oxidation reactions, and in copper proteins involved in dioxygen (O2) processing for reversible O2-binding, O2-activation leading to substrate oxidations (e.g., in monooxygenases) or protein oxidase reduction of O2 to produce H2O2 or water. Among copper-dioxygen adducts, several types of peroxo-dicopper(II) complexes have been well-characterized, with the type of coordination/structure dictated by the nature (denticity, donor atom type, etc.) of the ligand bound to the copper ion. Prominent among these are the trans-μ–1,2–(end-on) peroxo dicopper(II) (TP) and μ–η2:η2-peroxo-dicopper species (SP); either of these may isomerize to the bis(μ-oxo)dicopper(III) complexes (O) (Scheme 1).1–10 All of these CuI/O2 derived dicopper product species have been studied extensively with respect to their inherant or comparative spectroscopic signatures; their differential reactivity with substrates has also been widely investigated.11–19
Scheme 1.
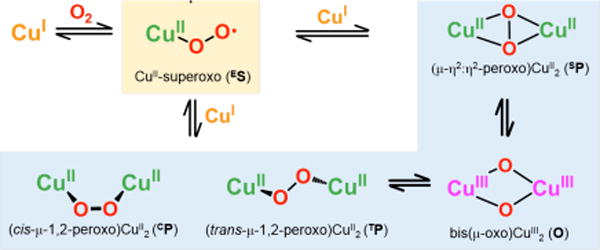
Further, these Cu2-O2 species are strong light absorbers, with prominent UV and/or visible region peroxo- or oxo-to-copper-ion charge transfer transitions. In fact, there are now a few cases known where laser-induced photolysis-excitation leads to photoejection of molecular oxygen, two being synthetic cupric-superoxide (ES) coordination complexes,18a and others include protein Cu2(O2) adducts.20 For such cases, nanosecond laser flash photolysis can be used to follow the rebinding kinetics-thermodynamics of O2 to the copper(I) species produced for systems that bind molecular oxygen faster than can be followed by solution spectroscopic stopped-flow kinetics methods.14a,b,d–g
On the other hand, the identification, characterization or investigation of the dynamics of photoexcited states has been an elusive subject since (i) they are very short lived and (ii) because these solution phase Cu-dioxygen adducts (i.e. 1, 2, 3 or similar) are generally only stable at low-temperatures (< −80 °C), precluding the investigation of excited-state fast photodynamics using femtosecond laser flash photolysis, normally measured at room temperature.
In the present work, we adjusted instrumental conditions (see Experimental Section) in order to enable low temperature (−55 to −94 °C) solution femtosecond laser induced excited state dynamics studies. When the new apparatus is used to study well-known peroxo-dicopper(II) complexes, it has become possible to detect and characterize unprecedented and perhaps unexpected (vide infra) mixed-valent transient CuICuII-superoxide species. Further, monitoring of their subsequent fast (i.e., picosecond) reactions dynamics has also become achievable. The species studied and described here are the TP complex [(tmpa)CuII-(O2)-CuII(tmpa)]2+ (1) {tmpa = tris-(2-pyridyl-methyl)amine}7 and the complexes with side-on O22−-binding, μ–η2:η2-peroxo dicopper(II) complexes [(N5)CuII2-(O2)]2+ (2) {N5 = −(CH2)5-linked bis[(2–(2–pyridyl)ethyl)amine]) (PY2) units} and [(N3)CuII2-(O2)]2+ (3) {N3 = (CH2)3-linked PY2 units} (Chart 1).8c,d,e
Chart 1.
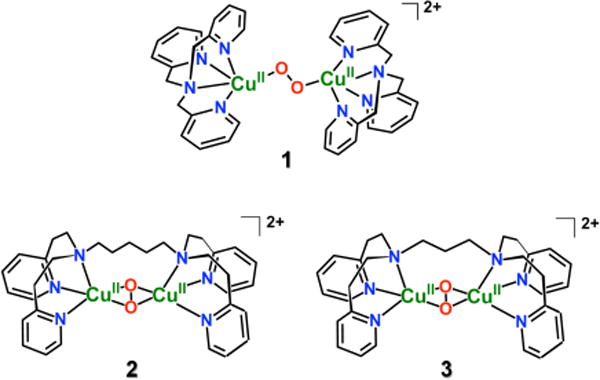
Interestingly, the nature of the excited state species formed was similar in all cases (1–3): a previously unobserved CuII-superoxide…CuI species, ([CuII(O2•−)CuI]2+). Subsequent novel transformations occurred, and UV-vis spectroscopic monitoring allowed for the determination of kinetics and activation parameters. Notably, the two varying classes of compounds, represented by end-on (1) and side-on (2 and 3) peroxo-dicopper(II) complexes, follow unique reaction pathways. The differential behavior can be explained on the basis of the nature of the ligands employed within these complexes (Chart 1), that influenced the thermodynamic stabilities of (i) the ligand-CuI (vs CuII) complexes, and (ii) peroxo-Cu2II structures. The present study opens an exciting research area on reactive excited states of metal-O2 intermediates.
Results and Discussion
Photodynamics of Peroxo (TP) Complex [(tmpa)CuII-(O2)-CuII-(tmpa)]2+ (1)
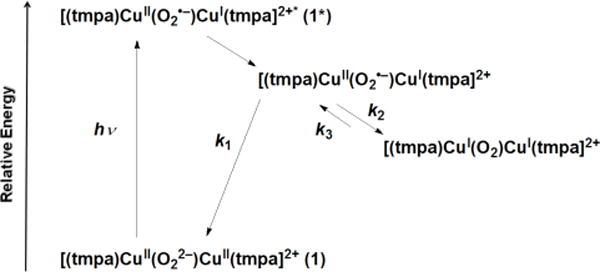
The previously well characterized trans–μ– 1,2–(end-on) peroxo dinuclear copper(II) complex 1 was prepared by reaction of [(tmpa)CuI(CH3CN)]BArF (BArF = B(C6F5)4−) with O2 at low temperature in acetone (Figure 1a, red spectrum) at −80 °C.7 The complex was brightly colored due to the presence of intense peroxo-to-copper charge transfer bands in the visible region. The transient absorption spectrum measured 1.9 ps after femtosecond laser excitation of 1 exhibited a positive absorption band at λmax = 739 nm and negative absorption difference (bleaching) features at λmax = 525 and 600 nm, Figure 1b. The bleach features were a mirror image of the steady state absorption spectrum of 1, consistent with the loss of the ground state species. Indeed, a simulation based on the assumption that light excitation of 1 generated a species that did not absorb visible light, accurately models the two bleach absorption bands at λmax = 525 and 600 nm. However, such modeling did not explain the positive absorption band at λmax = 739 nm. The observed absorption maximum and full-width-at-half-maximum were similar to those previously reported for CuII-superoxide complexes [(tmpa)CuII(O2)]+,14b [(TMG3tren)CuII(O2)]+18, [(PV-tmpa)-CuII(O2)]+ (PV-tmpa = [bis-(pyrid-2-ylmethyl){[6-(pival-amido)pyrid-2-yl]methyl}amine]),19 as well as to those of several other known copper(II)-superoxide compounds.21,22 Based on this prior data, the transient absorption spectra observed upon femto-second laser excitation of 1 (black line in Figure 1b) was assigned to the mixed-valent CuI-CuII-superoxide (O2•−) complex [(tmpa)CuII(O2•−)CuI(tmpa)]2+ produced by intramolecular electron transfer from the peroxo moiety to one of the two CuII centers in the Franck-Condon excited state 1* (Scheme 2).
Figure 1.
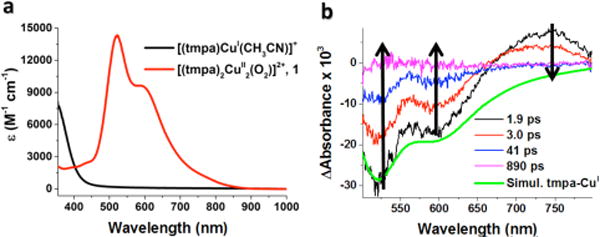
(a) Absorption spectrum of 1 (red line) obtained from oxygenation of [(tmpa)CuI(CH3CN)]+ (black line) at −80 °C in acetone. (b) Transient difference absorption spectra of 1 in acetone at −80 °C measured at the indicated delay times after 490 nm femto-second laser excitation (2 mJ/pulse and fwhm = 130 fs). Overlaid in green is a simulated spectrum for 1, generated by subtraction of the red spectrum from the black spectrum shown in (a).
Scheme 2.
Very similar absorption features were observed after pulsed laser excitation of 2 and 3 under the same conditions. The absorption maxima for the positive absorption feature assigned to the mixed-valent intermediates were determined from Gaussian fits of the observed data (Figure S1). A linear relationship between the absorption change at 750 nm,23 due to the CuI-CuII-superoxide (O •−) complex [(tmpa)CuII(O2•−)CuI(tmpa)]2+, and the laser fluence was observed over a range of 11–46 μJ/pulse consistent with a monophotonic process in the formation of the CuII-O2•−-CuI complex (Figure S2 in SI).
To confirm that the chemistry described here (vide supra) was truly due to the light-induced reaction of the peroxo complex[(tmpa)CuII-(O2)-CuII−(tmpa)]2+ (1), control experiments were carried out. No photoactivity was observed after irradiation of either the mononuclear tmpa-copper(I) precursor complex alone, or the decomposition products of [(tmpa)CuII-(O2)-CuII−(tmpa)]2+ (1) (formed by warming a cryogenically produced solution of 1 up to room temperature) and subsequent re-chilling.
Further Reactions of [(tmpa)CuII(O2•−)CuI(tmpa)]2+ (λmax, 739 nm)
Single wavelength kinetics monitored at 600 and 750 nm are shown in Figure 2. The fastest decay, observed within the first 5 ps after laser excitation of 1, was the partial recovery of the bleach at 600 nm that occurs with a first-order rate constant k1 = (2.8 ± 0.4) × 1012 s−1 (Figure 2a). This corresponds to back electron transfer from the CuI center to O2•− to regenerate 1 from the mixed-valent CuII-O2•−-CuI intermediate (k1 in Scheme 2): CuII−O2•−-CuI → CuII-O22−-CuII (1).
Figure 2.
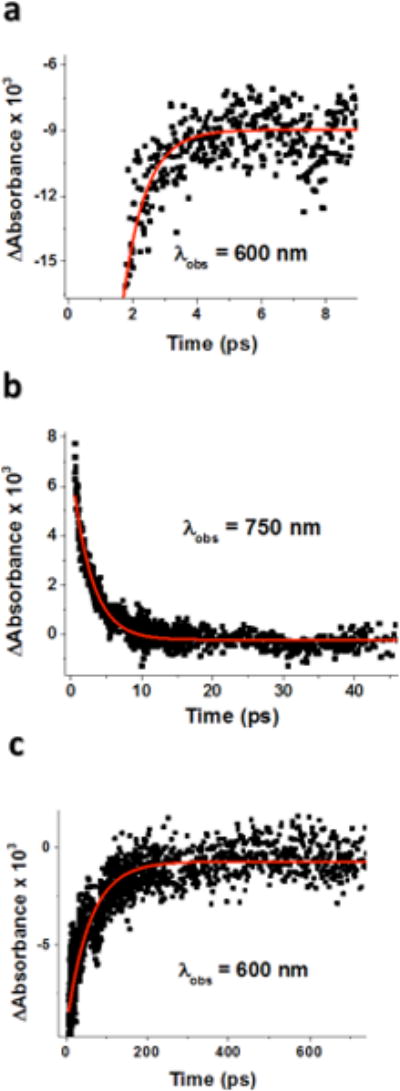
Time courses of femtosecond laser-induced reactions of 1 in acetone at −80 °C. Overlaid in red are fits to first-order kinetic models. (a) Fast partial recovery of the bleaching at 600 nm. (b) Decay of the absorbance difference observed at 750 nm due to the complex ([(tmpa)CuII(O2•−)CuI(tmpa)]2+). (c) The slower recovery of the bleaching observed at 600 nm to completely regenerate 1.
On the other hand, the decay of the absorption at 750 nm with rate constant k2 = (4.0 ± 0.5) × 1011 s−1 at −80 °C, due to the disappearance of the CuII-O2•− moiety in the mixed-valent intermediate (Figure 2b), is significantly slower than the fast partial recovery of the bleaching at 600 nm. This indicates that a second process involving electron transfer occurs, that from the O2•− moiety to the CuII center, to produce what formally is to be considered as the CuI2-O2 complex ([(tmpa)CuI(O2)-CuI(tmpa)]2+, a ‘caged’ O2-species (CuII-O2•−-CuI → CuI-O2-CuI; k2 in Scheme 2). The second step of the recovery of the bleaching at 600 nm with rate constant k3 = (1.8 ± 0.1) × 1010 s−1 (Figure 2c) corresponds, instead, to the stepwise back electron transfer from two CuI centers to the O2 moiety in the CuI2-O2 complex to regenerate 1. In this case, the rate-determining step is a, first, uphill back electron transfer from one CuI center to the O2 moiety in the CuI2-O2 complex (CuI-O2-CuI → CuII-O2•−-CuI) followed by the much faster (k1 >> k3; vide supra) second step back electron transfer from the other CuI center to the superoxide moiety in the CuII-O2•−-CuI complex to give back 1 (CuII-O2•−-CuI → CuII- O22−-CuII).
The temperature dependence of the rate constants k1, k2, and k3 was examined in the temperature range from −94 to −55 °C and the rate constants determined are listed in Table S1, S2, and S3, respectively, of the Supporting Information (SI). An Eyring plot of k1 for the electron transfer from the CuI center to the O2•− moiety in the mixed-valent CuII-O2•−-CuI complex ([(tmpa)CuII (O2•−)CuI(tmpa)]2+) to regenerate 1 is shown in Figure 3, where k1 is seen to be nearly temperature independent.
Figure 3.
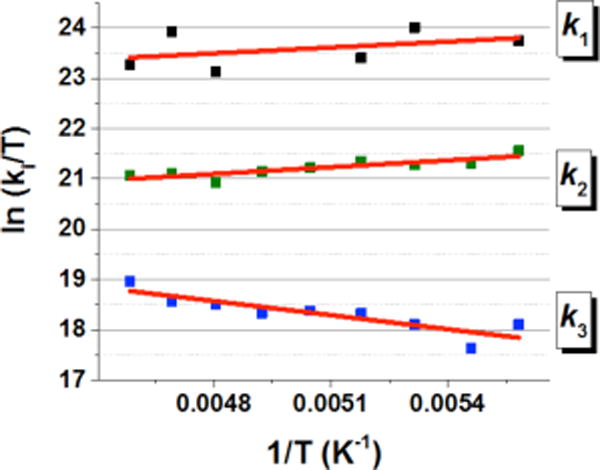
Eyring plots of k1 (electron transfer from the CuI center to the O2•− moiety in the CuII-O2•−-CuI complex to regenerate 1), k2 (electron transfer from the O2•− moiety to the CuII center in [(tmpa)CuII(O2•−)CuI(tmpa)]2+ to produce the ‘in cage’ CuI2-O2 complex) and k3 (stepwise back electron transfer reaction from the CuI centers to the O2 moiety in the CuI2-O2 intermediate to regenerate the peroxo complex [(tmpa)CuII-(O2)-CuII−(tmpa)]2+ (1)).
The ΔH‡ and ΔS‡ values obtained are listed in Table 1. For k1, both values were virtually zero. Such a small activation entropy is typical for an electron-transfer process involving no bond breaking. Thus, electron transfer from the CuI center to the O2•− moiety in the CuII-O2•−-CuI complex is a barrierless adiabatic process. Because the activation entropy for k1 is nearly zero (Table 1), it is likely that a cupric-superoxide CuII-O-O•− end-on structure is maintained in the CuII-O2•−-CuI complex, similar to that found in the μ-1,2-peroxo complex 1 (see Chart 1 and Scheme 3).
Table 1.
Kinetic Parameters for Femtosecond Laser-Induced Reactions of 1 at −80 °C
| rate constant, s−1 | ΔH‡,a | ΔS‡,b | ΔG‡,a | |
|---|---|---|---|---|
| k1 | (2.8 ± 0.4) × 1012 | −0.8 ± 0.8 | −4 ± 4 | 0.0 ± 0.8 |
| k2 | (4.0 ± 0.1) × 1011 | −0.5 ± 0.4 | −7 ± 5 | 0.9 ± 0.4 |
| k3 | (1.8 ± 0.1) × 1010 | 1.9 ± 0.4 | −4 ± 5 | 2.7 ± 0.4 |
ΔH‡ and ΔG‡(−80 °C), kcal mol−1
ΔS‡, cal K−1 mol−1.
Scheme 3.

The Eyring plot related to k2 for the electron transfer from the O2•− moiety to the CuII center to produce the CuI2-O2 complex is also shown in Figure 3, where k2 was nearly temperature independent as was the case of k1. Because no O2 release was observed from this CuI2-O2 complex, we postulate that O2 remains in a complex cage; further, the observed negative activation entropy suggests that the geometry of O2 in the CuI2-O2 complex is more restricted in the transition state; this could indicate, we speculate, that the binding mode of dioxygen changed to a side-on configuration also in the ‘in-cage’ CuI(O2)CuI complex, in contrast with that of the end-on geometry of 1 (Scheme 3).
The Eyring plot of the rate constant k3 for the back electron transfer from the CuI center to the O2 in the CuI2-O2 complex (Figure 3) afforded a positive activation enthalpy (ΔH‡ = 1.9 ± 0.4 kcal mol−1) and a nearly zero activation entropy (ΔS‡ = −4 ± 5 cal K−1 mol−1). The positive activation enthalpy is consistent with the barrierless electron transfer found for the reverse process (k2 in Scheme 2); because of that, the back electron transfer from one of the two CuI centers to the O2 moiety (k3) must be uphill, as shown in Scheme 2. The subsequent electron transfer from the other CuI center to the O2•− moiety to regenerate 1 (k1) is barrierless (vide supra) and much faster than the rate-determining back electron transfer from the CuI center to the O2 moiety (k1 >> k3). The ΔH‡ value found here for k3 (1.9 ± 0.4 kcal mol−1) is similar to that previously determined for the intermolecular electron transfer from [(tmpa)CuI]+ to O2 to produce the superoxide complex [(tmpa)CuIIO2]+ (ΔH‡ = 1.8 kcal mol−1).14b In the case of this intermolecular electron transfer reaction, however, the ΔS‡ value (−10 cal K−1 mol−1)14b was much more negative than the intramolecular electron-transfer reaction shown in Scheme 2 (virtually zero; vide supra). This is consistent with the fact that an intermolecular electron transfer should involve a negative activation entropy because it requires diffusion and the formation of a precursor complex prior to electron transfer, a requirement, instead, not necessary for the intramolecular electron transfer process observed here.
The lack of O2 release from the CuI2-O2 complex may be attributed to the high activation free energy barrier that needs to be overcome (ΔG‡ ~ 20 kcal mol−1 at −80 °C) to produce 2 equiv of [(tmpa)CuI]+ and O2, which are ~ 5 kcal mol−1 uphill as compared to the CuI2-O2 adduct, according to data previously reported for this reaction in THF solvent.7,14a,b
Photodynamics of Side-On Peroxo Dinuclear Copper(II) Complexes
The results on the end-on peroxo complex (1) described above are in sharp contrast to those observed for the side-on peroxo compound 2 ([(N5)CuII(O22−)CuII]2+),8c,d,e where O2 was instead released after laser excitation of the complex. The adduct 2 was produced by the reaction of [(N5)CuI2(CH3CN)]2+ with O2 in acetone at −80 °C and its electronic spectrum exhibits absorption bands at 360 nm (21800 M−1 cm−1) and at 430 nm (5200 M−1 cm−1), which have been previously assigned as peroxide-to-copper(II) ligand-to-metal charge-transfer (LMCT) transitions.8c,d,e
Femtosecond laser excitation of 2 in acetone at −94 °C resulted in observation of a transient absorption feature at λmax = 709 nm (Figure 4) which was consistent with the commonly observed low-energy but strong absorption peaks known for CuII-superoxide complexes.14b,18,19,21,22 Thus, the transient absorption spectrum observed upon femtosecond laser excitation of 2 in Figure 4 can be also assigned to a mixed-valent CuII-O2•−-CuI complex ([(N5)CuII(O2•−)CuI]2+) produced by intramolecular electron transfer from the peroxo ligand to the CuII center via the Franck-Condon LMCT excited state 2* shown in Scheme 4.
Figure 4.
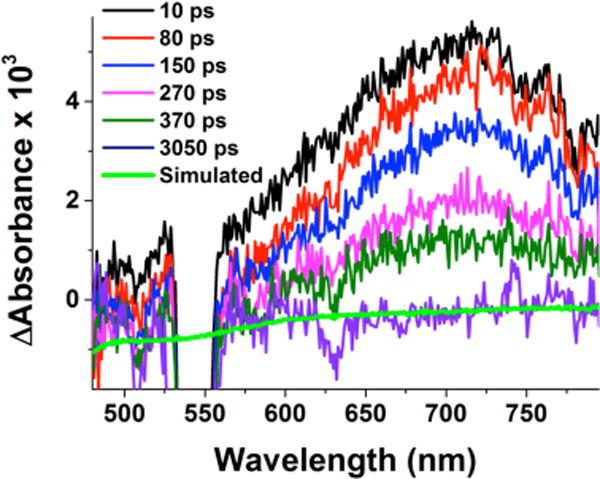
Transient absorption difference spectra of 2 in acetone at −94 °C measured at the indicated delay times after 436 nm femto-second laser excitation (2 mJ/pulse and fwhm = 130 fs). Overlaid in green is a simulated spectrum. The probe light is interrupted by the pump laser in the wavelength region around 540 nm.
Scheme 4.
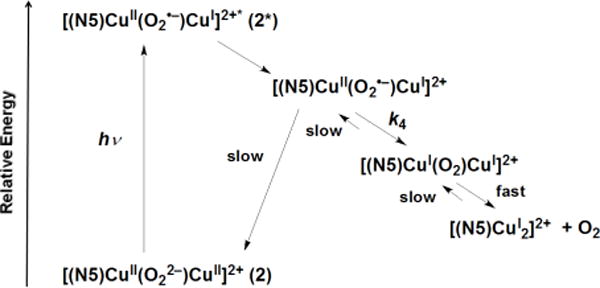
The decay of the absorption due to the CuII-O2•−-CuI complex derived from 2 in acetone at −80 °C, monitored at 720 nm, obeyed first-order kinetics with the rate constant (k4 in Scheme 4) (3.9 ± 0.3) ×109 s−1 which is much smaller than that derived for 1 [(4.0 ± 0.1) × 1011 s−1]. Representative kinetic data collected at −80 °C are shown in Figure 5.
Figure 5.
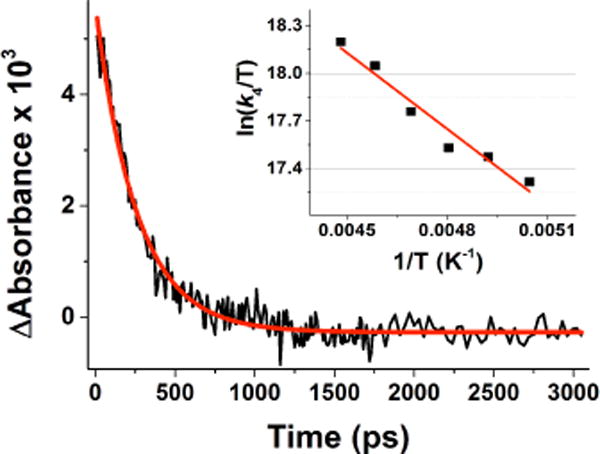
Decay time profile of the absorbance difference observed at 720 nm due to the CuII-O2•−-CuI complex derived from photoexcitation of 2 in acetone at −94 °C; Inset: Eyring plot of k4 for the intramo-lecular electron transfer from the O2•− ligand to the CuII center in the CuII-O2•−-CuI photoproduct complex derived from 2 in acetone.
The temperature dependence for the rate constant k4 was also examined in the temperature range −94/−55 °C and the related Eyring plot is shown as inset in Figure 5, giving ΔH‡ = 5.4 ± 1.0 kcal mol−1 and ΔS‡ = −9 ± 5 cal K−1 mol−1. The CuII-O2•−-CuI adduct formed from 2 decays much slower than that derived from 1 (smaller decay constant: k4 < k2) and shows a significantly larger ΔH‡ value. These results are consistent with a larger bond and solvent reorganization energy for the electron transfer from the superoxide anion to CuII in the CuII-O2•−-CuI photoproduct obtained from laser excitation of [(N5)CuII(O22−)CuII]2+ (2) with its side-on μ-η2-η2–peroxo binding compared to that of the decay of the CuII-O2•−-CuI photoproduct obtained from laser excitation of [(tmpa)CuII-(O22−)-CuII− (tmpa)]2+ (1) (Scheme 1) with its end-on μ-1,2-peroxo bridging mode.
Femtosecond laser excitation of an acetone solution of the analogue complex [(N3)CuII(O22−)CuII]2+ (3), supported by a binucleating chelating ligand having a shorter poly-methylene chain as compared to 2 (N3 vs N5), also results in the formation of a mixed-valent CuII-O2•−-CuI complex: [(N3)CuII(O2•−)CuI]2+. The latter exhibits a transient absorption signature at λmax = 685 nm (Figure 6).
Figure 6.
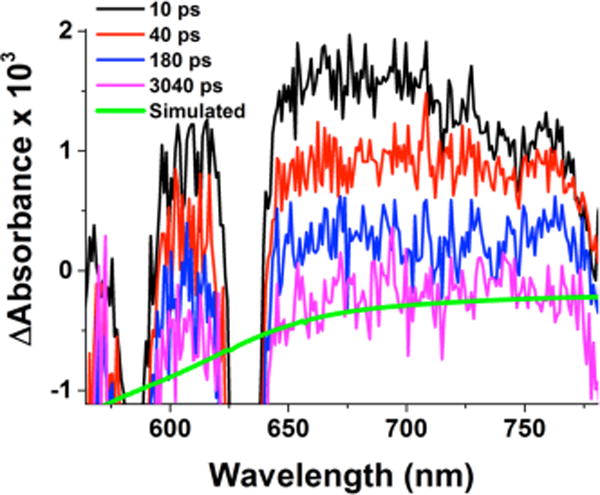
Transient absorption difference spectra of 3 in acetone at −94 °C measured at the indicated delay times after 436 nm femto-second laser excitation (2 mJ/pulse and fwhm = 130 fs). Overlaid in green is a simulated spectrum for the conversion 3 → CuI + CuI + O2 based on subtraction of the red spectrum from the black shown in Figure 8a. The probe light is interrupted by the pump laser in the wavelength region around 580 and 630 nm.
The observed blue-shift of the absorption band of [(N3)-CuII(O2•−)CuI]2+ as compared to that of [(N5)CuII(O2•−)CuI]2+ (685 nm, Figure 6, vs 709 nm, Figure 4) may be caused by a stronger electrostatic interaction between the CuI ion and the O2•− ligand in [(N3)CuII(O2•−)CuI]2+. This situation could arise because of the CuI ion’s closer spatial proximity as compared to what would be expected in [(N5)CuII(O2•−)…CuI]2+, due to the difference in poly-methylene chain length in the N3 vs N5 binucleating ligand (see Chart 1). Such differences do manifest themselves in other situations, such as for oxygenation reaction rates of dicopper(I) complexes with N3 vs N5 ligands.8c,d
The decay of the absorbance observed at 685 nm obeyed first-order kinetics with the rate constant (k4) of (7.3 ± 0.3) × 109 s−1 (Figure S3 of the SI), which was larger than that derived from 2 [(3.9 ± 0.1) × 109 s−1].
The energy diagram for the femtosecond laser-induced reactions of 2 is shown in Scheme 4. Femtosecond laser excitation into the lower energy LMCT band of 2 results in formation of the mixed-valent CuII-O2•−-CuI complex ([(N5)CuII(O2•−)CuI]2+) which decays via intramolecular electron transfer from the O2•− ligand to the CuII center to produce [(N5)CuI2]2+ with release of molecular oxygen. The finding of O2 release from the CuI2-O2 complex (Scheme 4) is in sharp contrast to the case of 1 (Scheme 2) where back electron transfer from the CuI center to the O2 moiety to regenerate 1 occurs without release of O2. The same energy diagram drawn for 2 can be applied to 3.
Photodynamics of Side-On Peroxo Dinuclear Copper(II) Complexes in the ms time domain (O2 re-binding kinetics)
The generated CuI complexes, [(N5)CuI2]2+ and [(N3)CuI2]2+, produced by laser excitation of [(N5)CuII(O22−)CuII]2+ (2) and [(N3)CuII(O22−)CuII]2+ (3) reacted cleanly with O2 to regenerate 2 and 3, respectively. The intermolecular reactions of the CuI complexes with O2 were monitored by nanosecond laser flash photolysis at low temperature. This approach is superior to the previously reported “flash-and-trap” experiments that required the inclusion of CO gas and/or other various experimental procedures.14a,b Here, we have added in dioxygen at various concentrations to examine [O2]-dependencies, and to also study variable temperature kinetics, allowing determination of the second-order rate constants and the activation parameters for the reactions of the CuI complexes with O2 (vide infra).
Nanosecond laser excitation of an acetone solution of 2 at −80 °C resulted in formation of [(N5)CuI2]2+ and O2 as shown in Figure 7b. The observed bleaching is fully consistent with that expected for the loss of O2 from the CuI2-O2 complex, because subtraction of the absorption spectrum of 2 from that of [(N5)CuI2]2+ afforded a simulated spectrum (red line in Figure 7b) which agrees well with the observed transient difference spectrum. The quantum yield for photoinduced release of O2 determined at 30 ns after the laser pulse was estimated to be 0.14 ± 0.01 (see Experimental Section). The absorption change was found to be linear with the laser fluence over a 5–100 mJ cm−2 range indicating that photoinduced release of O2 is a monophotonic process (inset in Figure 7b). Thus, the laser-induced photoejection of dioxygen from complexes 2 and 3 (see below) are formally very rarely observed (and see further discussion below) one-photon two-electron processes,
Figure 7.
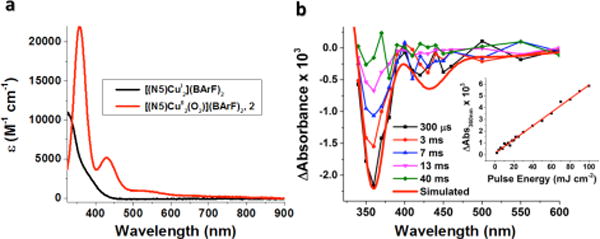
(a) Absorption spectrum of 2 (red line) obtained from oxygenation of [(N5)CuI2]2+ (black line) in acetone at −80 °C. (b) Transient absorption difference spectra collected at the indicated delay times after 532 nm laser excitation (10 mJ/pulse, 8–10 ns fwhm) of 2 in acetone at −80 °C. Overlaid in red on the experimental data is a simulated spectrum (Abs([(N5)CuI2(CH3CN)]2+)- Abs(2)), corresponding to the negative of the spectrum of [(N5)CuII(O22−)CuII]2+ (2). Inset: Difference in absorbance observed at 360 nm as a function of the applied laser energy for 2 in acetone at −80 °C.
Similar transient absorption spectra were observed for nanosecond laser flash photolysis measurements of an acetone solution of [(N3)CuI2]2+ at −80 °C (Figure 8b). The rate of recovery of the bleaching observed at 365 nm obeyed first-order kinetics in the presence of excess O2 and the observed pseudo-first-order rate constant increased linearly with O2 concentration (Figure S4).
Figure 8.
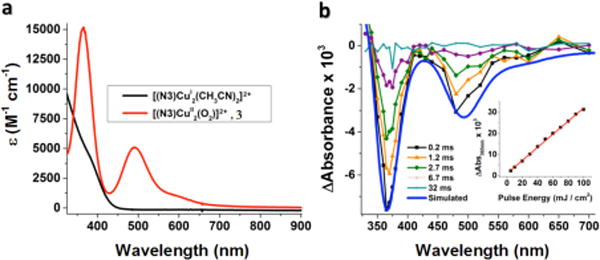
(a) Absorption spectrum of 3 (red line) obtained from oxygenation of [(N3)CuI2]2+ (black line) in acetone at −80 °C. (b) Transient absorption difference spectra collected at the indicated delay times after 532 nm laser excitation (10 mJ/pulse, 8–10 ns fwhm) of 3 in acetone at −80 °C. Overlaid in blue is a simulated spectrum based on subtraction of the red spectrum from the black in (a). The inset in (b) shows the magnitude of the absorption change as a function of the incident irradiance.
The second-order rate constants (kO2) for the reactions of [(N5)CuI2]2+ and [(N3)CuI2]2+ with O2 were determined at various temperatures as listed in Table 2 and S4 in Supporting Information. The kO2 values determined for [(N5)CuI2]2+ [(7.0 ± 1.9) × 103 M−1 s−1] and [(N3)CuI2]2+ [(3.8 ± 1.2) × 103 M−1 s−1] in acetone at −90 °C are only slightly larger than the corresponding reported values [(4.1 ± 0.3) × 103 M−1 s−1 and (1.1 ± 0.1) × 103 M−1 s−1] in CH2Cl2 at −90 °C, as measured by low-temperature stopped-flow spectroscopy,8c possibly due to the difference in solvation.
Table 2.
Rate Constants and Activation Parameters for the Reactions of [(N5)CuI2]2+, [(N3)CuI2]2+, Deoxy-Tyr, and Deoxy-Hc with O2
Eyring plots of kO2 for [(N3)CuI2]2+ and [(N5)CuI2]2+ are shown in Figures 9a and 9b, respectively, and activation parameters are listed in Table 2. The activation enthalpy found was comparable in the two cases and a more negative activation entropy for the reaction between [(N5)CuI2]2+ and O2 suggests, as previously observed,8c a greater inner-sphere reorganization energy in this case, probably due to the longer poly-methylene chain present in [(N5)CuI2]2+.
Figure 9.
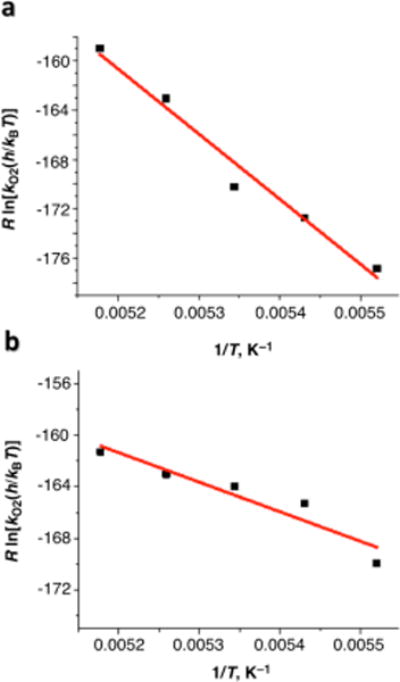
Eyring plots of kO2 for O2 binding to the dicopper(I) complex [(N3)CuI2]2+ which leads to 3 (a) or [(N5)CuI2]2+ which gives 2 (b) in acetone.
The kinetics of O2 coordination determined here also reveals noticeable similarities to that observed for both the copper-containing proteins hemocyanin (Hc; O2-carrier in mollusks and arthropods) and tyrosinase (Tyr; ubiquitous o-phenol monooxygenase).1,20,24,25 These possess similar dicopper active sites where each separated copper(I) ion binds three protein-derived histidine imidazole N-donor ligands and the oxygenated form consists of a CuII-(μ-η2:η2-O22−)-CuII moiety, the same peroxo binding mode found in [(N5)CuII2(O2)] 2+ (2) and [(N3)CuII2(O2)]2+ (3) (Chart 1). Interestingly, the rate constants, when extrapolated at 21° C, as well as the activation parameters determined here for the formation of 2 and 3 are essentially the same with those previously reported for Tyr20a and Hc,20b,24 (Table 2).
Summary and Conclusion
The present study on the photodynamics of the excited states of CuII-O2 intermediates opens a new and exciting research area of reactive excited states of metal-O2 intermediates. Here, in summary, we reported on the first unambiguous example of an, overall, one-photon two-electron oxidation, that being the oxidation of peroxide to molecular oxygen occurring when the trans-μ-1,2–(end-on) peroxide dicopper(II) compound [(tmpa)CuII−(O2)−CuII−(tmpa)]2+ (1), or the μ-η2-η2-(side-on)-peroxide complexes [(N5)CuII(O22−)CuII]2+(2) and [(N3)CuII(O22−)CuII]2+(3) are illuminated with visible light. A stepwise electron transfer mechanism was elucidated employing a novel ultra-fast low-temperature transient absorption apparatus and new intermediates were observed and assigned as a mixed-valent CuII(O2•−)CuI species. While complex 1 converted to the ‘O2-caged’ dicopper(I) complex [(tmpa)CuI(O2)CuI−(tmpa)]2+ without O2-release, femtosecond illumination of complexes 2 and 3 under the same conditions showed a remarkably different behavior such that the observed mixed-valent CuII-superoxide-CuI intermediates derived from these complexes further decay to two CuI ions, with complete release of O2 via electron transfer from the superoxide ligand to the CuII moiety. Thus, the results imply that in the O2-binding process, certainly for oxygenation of [(N5)CuI2]2+ and [(N3)CuI2]2+, a transient mixed valent species [(Nn)CuII(O2•−)CuI]2+ forms first (see Eq. below); it is however unobservable because the initial reaction of O2 with one cuprous ion resides in a strongly left-lying equilibrium and the reaction with the second cuprous ion is fast (see also below).8c The only manner to observe
the CuII(O2•−)CuI species is as described here, the use of laser-photolysis starting with the peroxo-dicopper(II) complexes.
The different reaction pathways observed for the end-on (1 in Scheme 2) and the side-on (2 in Scheme 4 and complex 3) peroxo complexes may be thought of and explained in terms of the known much lower ligand-CuII/I reduction potentials (as determined by prior cyclic voltammetric measurements) on isolated ligand-copper(I) complexes (ligands: tmpa, N3, N5 or PY2). For tmpa-CuI, E° = 0.05 V vs SCE in acetone,14a,26,28 as compared with that for CuI with PY2 moieties as found in 2 or 3 (E° = +0.37 V vs SCE in acetone).8d,27,28 Thus, back-electron transfer from the CuI ion to O2 is favored in [(tmpa)CuIO2CuI(tmpa)]2+ (Scheme 2) {and in mixed-valent [(tmpa)CuII-(O2•−)CuI(tmpa)]2+} in comparison to the possible O2 release and production of two equiv [(tmpa)CuI]+. By contrast, O2 release from [(N5)CuI2O2]2+ and then the N5 mixed-valent [(N5)CuII(O2•−)CuI]2+ species is favored in comparison to the much slower back electron transfer from CuI to O2 in these intermediates (Scheme 4).
The disparate CuII/I reduction potentials in the two classes of compounds results from the presence of an additional N-donor atom bound to each CuI in the compounds derived from 1 compared to those derived from 2 and 3 (tetradentate tmpa vs tridentate N3 and N5), on one hand, and the different chelate ring size in the two cases (5-membered ring for 1 vs 6-membered ring for 2 and 3),8b on the other hand, which confer different coordination environments, peroxo binding modes, and electronic properties to the resulting O2-adducts. These variations translate into dramatic effects in electron transfer thermodynamics and kinetics, including the ability to photorelease molecular oxygen for the complexes 2 and 3 while not for 1.
It is interesting to note that in an earlier computational study from Metz and Solomon,29 on O2 binding to deoxy-Hc, the findings were that the process proceeds via a simultaneous double electron transfer between the two cuprous ions and O2, such that as dioxygen interacts with a first copper ion, the two copper ions approach each other and then the redox reaction occurs.: CuI…CuI (~ 4.3 Å separation) + O2 → CuII(O2)CuII (~3.6 Å Cu-Cu distance). The intermediacy of a discrete CuII-O2•−-CuI initial adduct was ruled out. Thus, our synthetic analog compounds (i.e., models) behave differently than the dicopper center found in that very special protein environment. The results observed here may be ascribed to the larger CuI…CuI average distances likely found in the “floppy” [(N5)CuI2]2+ and [(N3)CuI2]2+ complexes. In the CuI2/O2 reactions, the cuprous ion in a CuII(O2•−)CuI species is likely to initially not be close to the superoxide moiety. Supporting this view are findings in the solid state, where Cu…Cu distances in non-bridged dicopper complexes with N3, N4 or N5 ligands can vary from ~ 6 to 10 Å.8d,e And as explained above, the initial unfavorable interaction of O2 with a single cuprous ion in a PY2 environment precludes the possibility of detecting a mixed-valent CuII(O2•−)CuI intermediate species in the “forward” [(Nn)CuI2]2++ O2 direction.
Single photon absorption reactions that drive two-electron transfer reactions are relatively rare yet important for photocatalytic multi-electron transfer reactions. A highly relevant example is water oxidation to molecular oxygen that in addition to proton management requires four redox equivalents: two to form the O-O bond in peroxide; and an additional two to yield dioxygen gas.30 The last two are particularly important as the release of peroxide or superoxide can give rise to unwanted radical chemistry. The peroxide-to-copper charge transfer absorption bands reported herein harvest sunlight across the entire visible region and their photoreactivity indicates that with the proper peroxide coordination environment, light excitation does indeed drive the two-electron transfer release of dioxygen. It is interesting to speculate whether such photo-reactivity may also be included in the realm of newly discovered copper water oxidation catalysts.31
Experimental Section
Materials
All materials purchased were of the highest purity available from Sigma-Aldrich Chemical or Tokyo Chemical Industry (TCI) and were used as received, unless specified otherwise. Tetrahydrofuran for the synthesis was distilled under an inert atmosphere from Na/benzophenone and degassed with argon prior to use. Pentane and acetone were freshly distilled from calcium hydride and calcium sulfate, respectively, under an inert atmosphere and degassed prior to use. The tmpa ligand,7 the N3 and N5 ligands,8c and the [Cu1(CH3CN)4](BArF) complex32 (BArF = B(C6F5)4−) were synthesized according to literature procedures. [(N3)CuI2(CH3CN)](BArF)2 and [(N5)CuI2-(CH3CN)](BArF)2 were synthesized adding [CuI(CH3CN)4]−(BArF) (410 mg, 0.452 mmol) to either N3 (114 mg, 0.230 mmol) or N5 (120 mg, 0.230 mmol) in dry, air-free tetrahydrofuran (THF) (15 mL) and the resulting solution was allowed to stir for 30 minutes. The isolation of the compounds was afforded by precipitation, under argon atmosphere, in dry, deoxygenated pentane (60 mL). The yellow powders obtained were made re-precipitate from THF/pentane (10 mL/60 mL) for three times, in both cases. Identity and purity of ligands and complexes were verified by elemental analysis and/or 1H-NMR spectroscopy (see Figures S5–S8 in Supporting Information). Synthesis and manipulations of copper salts were performed according to standard Schlenk techniques or in a MBraun glovebox (with O2 and H2O levels below 1 ppm). UV-Vis spectra were recorded with a Cary 50 Bio spectrophotometer equipped with a liquid nitrogen chilled Unisoku USP-203-A cryostat. NMR spectroscopy was performed on Bruker 300 and 400 MHz instruments with spectra calibrated to either internal tetramethylsilane (TMS) standard or to residual protio solvent.
Determination of O2 Solubility in Acetone
Both the solubility of O2 in acetone at 25 °C (0.01134 mol/L) and the solubility at different temperatures were determined using data from temperature-dependent studies previously carried out.33 The formula used for the temperature dependence of the molar fraction solubility of O2 in acetone is given by eq 1,
| (1) |
where χ is the molar fraction solubility in of O2 in acetone and T is the absolute temperature.
Gas Mixing
Dioxygen (O2; Air Gas East, grade 4.4) was dried by passing the gas through a short column of supported P4010 (Aquasorb, Mallinkrodt). Red rubber tubing (Fisher Scientific; inner diameter: 1/4 in.; thickness: 3/16 in.) was used to attach the gas cylinders fitted with appropriate regulators to two MKS Instruments Mass-Flo Controllers (MKS Type 1179A) regulated by an MKS Instruments Multi Channel Flow Ratio/Pressure Controller (MKS Type 647C). The gas mixtures, N2/O2, were determined by the set flow rates of the two gases. For example, a 10% O2 mixture would be made by mixing O2 at a rate of 10 standard cubic centimeters per minute (sccm) with N2 at 90 sccm for a total flow of 100 sccm. By varying the ratio of O2 and N2 with the gas mixer, the concentration of the gases were determined by taking the percentage of the gas added and multiplying by the solubility of the corresponding gas in acetone.
Transient Absorption Measurements
The source for the pump and probe pulses for the femtosecond laser spectroscopy performed here were derived from the fundamental output of Integra-C (780 nm, 2 mJ/pulse and fwhm = 130 fs) at a repetition rate of 1 kHz. A total of 75% of the fundamental output of the laser was introduced into TOPAS, which has optical frequency mixers resulting in tunable range from 285 to 1660 nm, while the rest of the output was used for white light generation. Prior to generating the probe continuum, a variable neutral density filter was inserted in the path to generate stable continuum, and then the laser pulse was fed to a delay line that provides an experimental time window of 3.2 ns with a maximum step resolution of 7 fs. In our experiments, a wavelength at 490 nm of TOPAS output, which is the fourth harmonic of signal or idler pulses, was chosen as the pump beam. As this TOPAS output consists of not only desirable wavelength but also of unnecessary wavelengths, the latter was deviated using a wedge prism with wedge angle of 18°. The desirable beam was irradiated at the sample dell with a spot size of 1 mm diameter where it was merged with the white probe pulse in a close angle (< 10°). The probe beam after passing through the 2 mm sample cell put in a UNISOKU CoolSpeK (USP-203-BTT-OF) cryostat was focused on a fiber optic cable that was connected to a CCD spectrograph for recording the time-resolved spectra (450–800 nm). Typically, 2500 excitation pulses were averaged for 3 s to obtain the transient spectrum at a set delay time. Kinetic traces at appropriate wavelengths were assembled from the time-resolved spectral data.
Experimental information for the setup of the Nd:YAG flash-photolysis apparatus has been previously reported.34 The apparatus used for nanosecond laser spectroscopy was equipped with liquid nitrogen chilled Unisoku USP-203-A cryostat. The samples, [(N5)CuII2(O2)](BArF)2 and [(N3)CuII2(O2)](BArF)2, were irradiated with λex = 532 nm pulsed light (10 mJ/pulse) and data were collected at the monitored wavelengths from averages of 30 laser pulses. Samples (about 70 μM) were prepared under an inert atmosphere (drybox) in 1 cm quartz cuvettes with four polished windows made custom by Quark glass. The cuvettes were equipped with a 14/20 joint and Schlenk stopcock. Gas mixtures were added to sample solutions by direct bubbling through a 24-inch needle (19-gauge) for 5 s for 10 times with intervals of 10 s between each time. During data collection the gas flowed through the headspace of the sample solution into the cuvette.
Quantum Yield Determination
Quantum yields were determined in acetone solvent at −80 °C for the 532 nm excitation wavelength. Samples were prepared bubbling O2(g) in solutions of [(N3)CuI2(CH3CN)](BArF)2 in dried and distilled acetone at −80 °C. The absorbance of the samples at 532 nm (i.e., 0.14 at 532 nm) was monitored using a Cary 50 Bio spectrophotometer equipped with a liquid nitrogen chilled Unisoku USP-203-A cryostat. [Ru(bpy)3]Cl2 (bpy = 2,2′-bipyridine) in CH3CN at room temperature was used as an actinometer and the solutions were prepared to ensure to match the optical density at 532 nm. Data collection for the change in absorbance (ΔA) at the correspondent λmax values (365 nm) where the change in extinction coefficients (ΔΣ) are known was made. The quantum yields at the two excitation wavelengths were calculated using eq 2,
| (2) |
where “Actin” is [Ru(bpy)3]Cl2 in CH3CN at room temperature. The values used were ΔΣ450Actin = −10600 M−1 cm−1,35 and ΔΣ450Cu = −7264 M−1 cm−1, with the latter determined in this work. For the refractive index, the value 1.34163 for CH3CN (nCH3CN) at 298.15 K has been used,36 whereas a temperature correction of 0.00045 per Kelvin has been added to the refractive index of acetone at 293.15 K (1.359)37 to obtain the refractive index which has been used for acetone at 193.15 K in eq 2; (nacetone): 1.359 + [0.00045(293.15–193.15)] = 1.404.
Eyring Plots
Samples were prepared for the laser experiments bubbling O2 gas into acetone solutions of the correspondent CuI complex. For example, O2 was added to an acetone solution of [(tmpa)CuI(CH3CN)](BArF) (976 μM) at low temperature to generate 1. Laser measurements were performed in a temperature range from −94 °C to −55 °C and data were fitted with the Eyring equation (eq 3),
| (3) |
where h is Planck constant, kB is Boltzmann constant, and k is the rate constant. Temperature dependence studies have been performed in this work using 490 nm excitation wavelength.
Supplementary Material
Acknowledgments
S.F. thanks for research support for ALCA and SENTAN projects from JST, Japan. K.D.K. acknowledges financial support of this research from the National Institutes of Health, R01 GM28962. G.J.M. is grateful for research support from the National Science Foundation, CHE-1213357.
Footnotes
ASSOCIATED CONTENT
Supporting Information. Tables S1–S4 and Figures S1 – S8. This material is available free of charge via the Internet at http://pubs.acs.org.
References
- 1.(a) Solomon EI, Heppner DE, Johnston EM, Ginsbach JW, Cirera J, Qayyum M, Kieber-Emmons MT, Kjaergaard CH, Hadt RG, Tian L. Chem Rev. 2014;114:3659–3853. doi: 10.1021/cr400327t. [DOI] [PMC free article] [PubMed] [Google Scholar]; (b) Solomon EI, Ginsbach JW, Heppner DE, Kieber-Emmons MT, Kjaergaard CH, Smeets PJ, Tian L, Woertink JS. Faraday Discuss. 2011;148:11–39. doi: 10.1039/c005500j. [DOI] [PMC free article] [PubMed] [Google Scholar]
- 2.(a) Cramer CJ, Tolman WB. Acc Chem Res. 2007;40:601–608. doi: 10.1021/ar700008c. [DOI] [PMC free article] [PubMed] [Google Scholar]; (b) Lewis EA, Tolman WB. Chem Rev. 2004;104:1047–1076. doi: 10.1021/cr020633r. [DOI] [PubMed] [Google Scholar]; (c) Mirica LM, Ottenwaelder X, Stack TDP. Chem Rev. 2004;104:1013–1045. doi: 10.1021/cr020632z. [DOI] [PubMed] [Google Scholar]; (d) Kitajima N, Moro-oka Y. Chem Rev. 1994;94:737–757. [Google Scholar]
- 3.(a) Suzuki M. Acc Chem Res. 2007;40:609–617. doi: 10.1021/ar600048g. [DOI] [PubMed] [Google Scholar]; (b) Koval IA, Gamez P, Belle C, Selmeczi K, Reedijk J. Chem Soc Rev. 2006;35:814–840. doi: 10.1039/b516250p. [DOI] [PubMed] [Google Scholar]
- 4.(a) Fukuzumi S, Karlin KD. Coord Chem Rev. 2013;257:187–195. doi: 10.1016/j.ccr.2012.05.031. [DOI] [PMC free article] [PubMed] [Google Scholar]; (b) Fukuzumi S, Yamada Y, Karlin KD. Electrochim Acta. 2012;82:493–511. doi: 10.1016/j.electacta.2012.03.132. [DOI] [PMC free article] [PubMed] [Google Scholar]; (c) Fukuzumi S. Dalton Trans. 2015;44(15):6696–6705. doi: 10.1039/c5dt00204d. [DOI] [PubMed] [Google Scholar]
- 5.(a) Itoh S, Fukuzumi S. Acc Chem Res. 2007;40:592–600. doi: 10.1021/ar6000395. [DOI] [PubMed] [Google Scholar]; (b) Kodera M, Kano K. Bull Chem Soc Jpn. 2007;80:662–676. [Google Scholar]; (c) Itoh S, Fukuzumi S. Bull Chem Soc Jpn. 2002;75:2081–2095. [Google Scholar]
- 6.Hatcher LQ, Karlin KD. Adv Inorg Chem. 2006;58:131–184. [Google Scholar]
- 7.(a) Jacobson RR, Tyeklar Z, Farooq A, Karlin KD, Liu S, Zubieta J. J Am Chem Soc. 1988;110:3690–3692. [Google Scholar]; (b) Baldwin MJ, Ross PK, Pate JE, Tyeklar Z, Karlin KD, Solomon EI. J Am Chem Soc. 1991;113:8671–8679. [Google Scholar]; Tyeklar Z, Jacobson RR, Wei N, Murthy NN, Zubieta J, Karlin KD. J Am Chem. 1993;115:2677–2689. [Google Scholar]
- 8.(a) Karlin KD, Kaderli S, Zuberbühler AD. Acc Chem Res. 1997;30:139. [Google Scholar]; (b) Hatcher LQ, Karlin KD. J Biol Inorg Chem. 2004;9:669–683. doi: 10.1007/s00775-004-0578-4. [DOI] [PubMed] [Google Scholar]; (c) Liang HC, Karlin KD, Dyson R, Kaderli S, Jung B, Zuberbühler AD. Inorg Chem. 2000;39:5884–5894. doi: 10.1021/ic0007916. [DOI] [PubMed] [Google Scholar]; (d) Karlin KD, Tyeklár Z, Farooq A, Haka MS, Ghosh P, Cruse RW, Gultneh Y, Hayes JC, Toscano PJ, Zubieta J. Inorg Chem. 1992;31:1436–1451. [Google Scholar]; (e) Thyagarajan S, Murthy NN, Narducci Sarjeant AA, Karlin KD, Rokita SE. J Am Chem Soc. 2006;128:7003–7008. doi: 10.1021/ja061014t. [DOI] [PMC free article] [PubMed] [Google Scholar]
- 9.(a) Helton ME, Chen P, Paul PP, Tyeklar Z, Sommer RD, Zakharov LN, Rheingold AL, Solomon EI, Karlin KD. J Am Chem Soc. 2003;125:1160–1161. doi: 10.1021/ja027574j. [DOI] [PubMed] [Google Scholar]; (b) Lee Y, Lee D-H, Park GY, Lucas HR, Narducci SAA, Kieber-Emmons MT, Vance MA, Milligan AE, Solomon EI, Karlin KD. Inorg Chem. 2010;49:8873–8885. doi: 10.1021/ic101041m. [DOI] [PMC free article] [PubMed] [Google Scholar]
- 10.(a) Dalle KE, Gruene T, Dechert S, Demeshko S, Meyer F. J Am Chem Soc. 2014;136:7428–7434. doi: 10.1021/ja5025047. [DOI] [PubMed] [Google Scholar]; (b) Porras G, Ana G, Zeitouny J, Gomila A, Douziech B, Cosquer N, Conan F, Reinaud O, Hapiot P, Le Mest Y, Lagrost C, Le Poul N. Dalton Trans. 2014;43:6436–6445. doi: 10.1039/c3dt53548g. [DOI] [PubMed] [Google Scholar]
- 11.(a) Park GY, Qayyum MF, Woertink J, Hodgson KO, Hedman B, Narducci Sarjeant AA, Solomon EI, Karlin KD. J Am Chem Soc. 2012;134:8513–8524. doi: 10.1021/ja300674m. [DOI] [PMC free article] [PubMed] [Google Scholar]; (b) Shearer J, Zhang CX, Zakharov LN, Rheingold AL, Karlin KD. J Am Chem Soc. 2005;127:5469–5483. doi: 10.1021/ja045191a. [DOI] [PubMed] [Google Scholar]
- 12.(a) Rolff M, Schottenheim J, Decker H, Tuczek F. Chem Soc Rev. 2011;40:4077–4098. doi: 10.1039/c0cs00202j. [DOI] [PubMed] [Google Scholar]; (b) De A, Mandal S, Mukherjee R. J Inorg Biochem. 2008;102:1170–1189. doi: 10.1016/j.jinorgbio.2008.01.030. [DOI] [PubMed] [Google Scholar]; (c) Rolff M, Tuczek F. Angew Chem Int Ed. 2008;47:2344–2347. doi: 10.1002/anie.200705533. [DOI] [PubMed] [Google Scholar]; (d) Rolle C, III, Saracini C, Karlin KD. Encyclopedia of Inorganic and Bioinorganic Chemistry. Johns Wiley & Sons, Ltd; Chichester: 2014. http://dx.doi.org/10.1002/9781119951438.eibc0049.pub2. [Google Scholar]
- 13.(a) Himes RA, Barnese K, Karlin KD. Angew Chem Int Ed. 2010;49:6714–6716. doi: 10.1002/anie.201003403. [DOI] [PubMed] [Google Scholar]; (b) Balasubramanian R, Smith SM, Rawat S, Yatsunyk LA, Stemmler TL, Rosenzweig AC. Nature. 2010;465:115–119. doi: 10.1038/nature08992. [DOI] [PMC free article] [PubMed] [Google Scholar]; (c) Himes RA, Karlin KD. Proc Natl Acad Sci USA. 2009;106:18877–18878. doi: 10.1073/pnas.0911413106. [DOI] [PMC free article] [PubMed] [Google Scholar]; (d) Chan SI, Yu Steve S-F. Acc Chem Res. 2008;41:969–979. doi: 10.1021/ar700277n. [DOI] [PubMed] [Google Scholar]
- 14.(a) Lucas HR, Meyer GJ, Karlin KD. J Am Chem Soc. 2010;132:12927–12940. doi: 10.1021/ja104107q. [DOI] [PMC free article] [PubMed] [Google Scholar]; (b) Fry HC, Scaltrito DV, Karlin KD, Meyer GJ. J Am Chem Soc. 2003;125:11866–11871. doi: 10.1021/ja034911v. [DOI] [PubMed] [Google Scholar]; (c) Lucas HR, Li L, Narducci SAA, Vance MA, Solomon EI, Karlin KD. J Am Chem Soc. 2009;131:3230–3245. doi: 10.1021/ja807081d. [DOI] [PMC free article] [PubMed] [Google Scholar]; (d) Wagnerova DM, Lang K. Coord Chem Rev. 2011;255:2904–2911. [Google Scholar]; (e) Vogler A, Kunkely H. Coord Chem Rev. 2006;250:1622–1626. [Google Scholar]; (f) Fry HC, Hoertz PG, Wasser IM, Karlin KD, Meyer GJ. J Am Chem Soc. 2004;126:16712–16713. doi: 10.1021/ja045195f. [DOI] [PubMed] [Google Scholar]; (g) Ye X, Demidov A, Champion PM. J Am Chem Soc. 2002;124:5914–5924. doi: 10.1021/ja017359n. [DOI] [PubMed] [Google Scholar]
- 15.(a) Garcia-Bosch I, Company A, Frisch JR, Torrent-Sucarrat M, Cardellach M, Gamba I, Gueell M, Casella L, Que L, Jr, Ribas X, Luis JM, Costas M. Angew Chem Int Ed. 2010;49:2406–2409. doi: 10.1002/anie.200906749. [DOI] [PMC free article] [PubMed] [Google Scholar]; (b) Mandal S, Mukherjee J, Lloret F, Mukherjee R. Inorg Chem. 2012;51:13148–13161. doi: 10.1021/ic3013848. [DOI] [PubMed] [Google Scholar]; (c) Garcia-Bosch I, Ribas X, Costas M. Chem–Eur J. 2012;18:2113–2122. doi: 10.1002/chem.201102372. [DOI] [PubMed] [Google Scholar]
- 16.(a) Rolff M, Hamann JN, Tuczek F. Angew Chem Int Ed. 2011;50:6924–6927. doi: 10.1002/anie.201102332. [DOI] [PubMed] [Google Scholar]; (b) Rolff M, Schottenheim J, Peters G, Tuczek F. Angew Chem Int Ed. 2010;49:6438–6442. doi: 10.1002/anie.201000973. [DOI] [PubMed] [Google Scholar]; (c) Sander O, Henss A, Naether C, Würtele C, Holth MC, Schindler S, Tuczek F. Chem–Eur J. 2008;14:9714–9729. doi: 10.1002/chem.200800799. [DOI] [PubMed] [Google Scholar]
- 17.(a) Matsumoto T, Ohkubo K, Honda K, Yazawa A, Furutachi H, Fujinami S, Fukuzumi S, Suzuki M. J Am Chem Soc. 2009;131:9258–9267. doi: 10.1021/ja809822c. [DOI] [PubMed] [Google Scholar]; (b) Company A, Palavicini S, Garcia-Bosch I, Mas-Balleste R, Que L, Jr, Rybak-Akimova EV, Casella L, Ribas X, Costas M. Chem–Eur J. 2008;14:3535–3538. doi: 10.1002/chem.200800229. [DOI] [PubMed] [Google Scholar]; (c) Osako T, Ohkubo K, Taki M, Tachi Y, Fukuzumi S, Itoh S. J Am Chem Soc. 2003;125:11027–11033. doi: 10.1021/ja029380+. [DOI] [PubMed] [Google Scholar]; (d) Henson MJ, Vance MA, Zhang CX, Liang H-C, Karlin KD, Solomon EI. J Am Chem Soc. 2003;125:5186–5192. doi: 10.1021/ja0276366. [DOI] [PubMed] [Google Scholar]; (e) Itoh S, Kumei H, Taki M, Nagatomo S, Kitagawa T, Fukuzumi S. J Am Chem Soc. 2001;123:6708–6709. doi: 10.1021/ja015702i. [DOI] [PubMed] [Google Scholar]
- 18.(a) Saracini C, Liakos DG, Rivera JEZ, Neese F, Meyer GJ, Karlin KD. J Am Chem Soc. 2014;136:1260–1263. doi: 10.1021/ja4115314. [DOI] [PMC free article] [PubMed] [Google Scholar]; (b) Woertink JS, Tian L, Maiti D, Lucas HR, Himes RA, Karlin KD, Neese F, Wurtele C, Holthausen MC, Bill E, Sundermeyer J, Schindler S, Solomon EI. Inorg Chem. 2010;49:9450–9459. doi: 10.1021/ic101138u. [DOI] [PMC free article] [PubMed] [Google Scholar]
- 19.Peterson RL, Himes RA, Kotani H, Suenobu T, Tian L, Siegler MA, Solomon EI, Fukuzumi S, Karlin KD. J Am Chem Soc. 2011;133:1702–1705. doi: 10.1021/ja110466q. [DOI] [PMC free article] [PubMed] [Google Scholar]
- 20.(a) Hirota S, Kawahara T, Lonardi E, de Waal E, Funasaki N, Canters GW. J Am Chem Soc. 2005;127:17966–17967. doi: 10.1021/ja0541128. [DOI] [PubMed] [Google Scholar]; (b) Hirota S, Kawahara T, Beltramini M, Di Muro P, Magliozzo RS, Peisach J, Powers LS, Tanaka N, Nagao S, Bubacco L. J Biol Chem. 2008;283:31941–31948. doi: 10.1074/jbc.M803433200. [DOI] [PMC free article] [PubMed] [Google Scholar]
- 21.(a) Kunishita A, Kubo M, Sugimoto H, Ogura T, Sato K, Takui T, Itoh S. J Am Chem Soc. 2009;131:2788–2789. doi: 10.1021/ja809464e. [DOI] [PubMed] [Google Scholar]; (b) Kunishita A, Ertem MZ, Okubo Y, Tano T, Sugimoto H, Ohkubo K, Fujieda N, Fukuzumi S, Cramer CJ, Itoh S. Inorg Chem. 2012;51:9465–9480. doi: 10.1021/ic301272h. [DOI] [PubMed] [Google Scholar]; (c) Tano T, Okubo Y, Kunishita A, Kubo M, Sugimoto H, Fujieda N, Ogura T, Itoh S. Inorg Chem. 2013;52:10431–10437. doi: 10.1021/ic401261z. [DOI] [PubMed] [Google Scholar]; (d) Donoghue PJ, Gupta AK, Boyce DW, Cramer CJ, Tolman WB. J Am Chem Soc. 2010;132:15869–15871. doi: 10.1021/ja106244k. [DOI] [PMC free article] [PubMed] [Google Scholar]
- 22.Peterson RL, Ginsbach JW, Cowley RE, Qayyum MF, Himes RA, Siegler MA, Moore CD, Hedman B, Hodgson KO, Fukuzumi S, Solomon EI, Karlin KD. J Am Chem Soc. 2013;135:16454–16467. doi: 10.1021/ja4065377. [DOI] [PMC free article] [PubMed] [Google Scholar]
- 23.Radiance-dependent and kinetic data for the decrease of the broad absorption due to CuIIO2•− were collected at 750 nm instead of λmax = 730 nm to minimize the contribution of the overlapping spectral bleach due to the CuI moiety.
- 24.(a) Andrew CR, McKillop KP, Sykes AG. Biochim Biophys Acta, Protein Struct M. 1993;1162:105–114. doi: 10.1016/0167-4838(93)90135-e. [DOI] [PubMed] [Google Scholar]; (b) Rodríguez-López JN, Fenoll LG, García-Ruiz PA, Varón R, Tudela J, Thorneley RNF, García-Cánovas F. Biochem. 2000;39:10497–10506. doi: 10.1021/bi000539+. [DOI] [PubMed] [Google Scholar]
- 25.(a) Magnus KA, Hazes B, Ton-That H, Bonaventura C, Bonaventure J, Hol WG. Proteins. 1994;19:302–309. doi: 10.1002/prot.340190405. [DOI] [PubMed] [Google Scholar]; (b) Solomon EI, Sundaram UM, Machonkin TE. Chem Rev. 1996;96:2563–2605. doi: 10.1021/cr950046o. [DOI] [PubMed] [Google Scholar]
- 26.(a) Fukuzumi S, Kotani H, Lucas HR, Doi K, Suenobu T, Peterson RL, Karlin KD. J Am Chem Soc. 2010;132:6874–6875. doi: 10.1021/ja100538x. [DOI] [PMC free article] [PubMed] [Google Scholar]; (b) Kakuda S, Peterson RL, Ohkubo K, Karlin KD, Fukuzumi S. J Am Chem Soc. 2013;135:6513–6522. doi: 10.1021/ja3125977. [DOI] [PMC free article] [PubMed] [Google Scholar]
- 27.(a) Pidcock E, Obias HV, Abe M, Liang H-C, Karlin KD, Solomon EI. J Am Chem Soc. 1999;121:1299–1308. [Google Scholar]; (b) Tahsini L, Kotani H, Lee Y-M, Cho J, Nam W, Karlin KD, Fukuzumi S. Chem–Eur J. 2012;18:1084–1093. doi: 10.1002/chem.201103215. [DOI] [PMC free article] [PubMed] [Google Scholar]
- 28.(a) Tahsini L, Lee Y-M, Ohkubo K, Nam W, Karlin KD. J Am Chem Soc. 2012;134:7025–7035. doi: 10.1021/ja211656g. [DOI] [PMC free article] [PubMed] [Google Scholar]; (b) Das D, Lee Y-M, Ohkubo K, Nam W, Karlin KD, Fukuzumi S. J Am Chem Soc. 2013;135:2825–2834. doi: 10.1021/ja312523u. [DOI] [PMC free article] [PubMed] [Google Scholar]; (c) Das D, Lee Y-M, Ohkubo K, Nam W, Karlin KD, Fukuzumi S. J Am Chem Soc. 2013;135:4018–4026. doi: 10.1021/ja312256u. [DOI] [PMC free article] [PubMed] [Google Scholar]
- 29.Metz M, Solomon EI. J Am Chem Soc. 2001;123:4938–4950. doi: 10.1021/ja004166b. [DOI] [PubMed] [Google Scholar]
- 30.Bard AJ, Fox MA. Acc Chem Res. 1995;28:141–145. [Google Scholar]
- 31.(a) Barnett SM, Goldberg KI, Mayer JM. Nat Chem. 2012;4:498–502. doi: 10.1038/nchem.1350. [DOI] [PubMed] [Google Scholar]; (b) Zhang MT, Chen Z, Kang P, Meyer TJ. J Am Chem Soc. 2013;135:2048–2051. doi: 10.1021/ja3097515. [DOI] [PubMed] [Google Scholar]; (c) Chen Z, Meyer TJ. Angew Chem Int Ed. 2013;52:700–703. doi: 10.1002/anie.201207215. [DOI] [PubMed] [Google Scholar]
- 32.Liang HC, Kim E, Incarvito CD, Rheingold AL, Karlin KD. Inorg Chem. 2002;41:2209–2212. doi: 10.1021/ic010816g. [DOI] [PubMed] [Google Scholar]
- 33.(a) Fogg PGT, Gerrard W. Solubility of Gases in Liquids: a Critical Evaluation of Gas/Liquid Systems in Theory and Practice. Wiley; Chichester: 1991. [Google Scholar]; (b) Fischer K, Wilken M. J Chem Thermodyn. 2001;33:1285–1308. [Google Scholar]; (c) Battino R. IUPAC Solubility Data Series: Oxygen and Ozone. Pergamon; Oxford, New York: 1981. [Google Scholar]
- 34.Argazzi R, Bignozzi CA, Heimer TA, Castellano FN, Meyer GJ. Inorg Chem. 1994;33:5741–5749. [Google Scholar]
- 35.Yoshimura A, Hoffman MZ, Sun H. J Photochem Photobiol A. 1993;70:29–33. [Google Scholar]
- 36.Iloukhani H, Almasi M. Thermochim Acta. 2009;495:139–148. [Google Scholar]
- 37.Kurtz SS, Jr, Wikingsson AE, Camin DL, Thompson AR. J Chem Eng Data. 1965;10:330–334. [Google Scholar]
Associated Data
This section collects any data citations, data availability statements, or supplementary materials included in this article.


