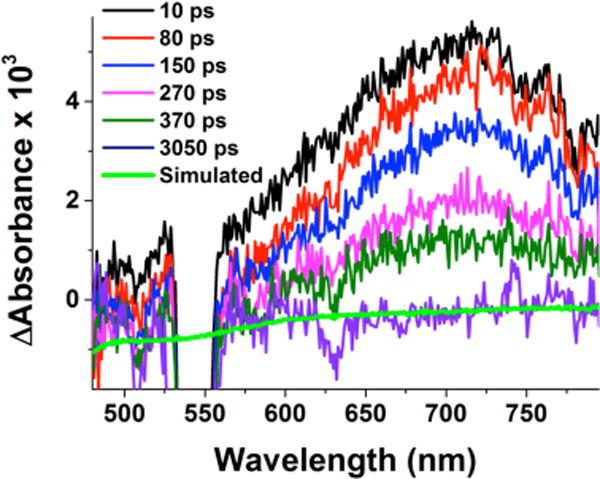
Figure 4.

Transient absorption difference spectra of 2 in acetone at −94 °C measured at the indicated delay times after 436 nm femto-second laser excitation (2 mJ/pulse and fwhm = 130 fs). Overlaid in green is a simulated spectrum. The probe light is interrupted by the pump laser in the wavelength region around 540 nm.
