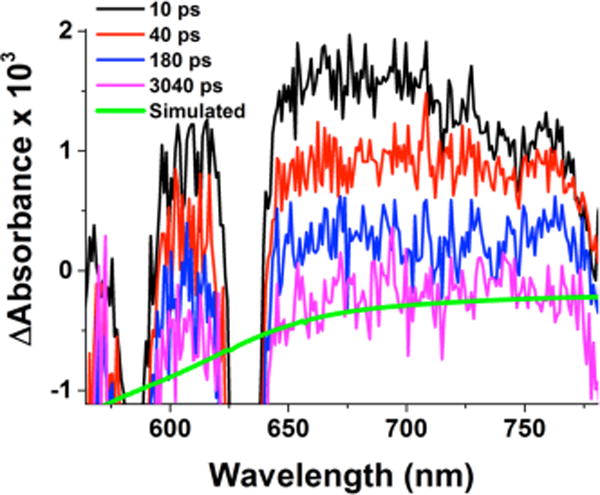
Figure 6.

Transient absorption difference spectra of 3 in acetone at −94 °C measured at the indicated delay times after 436 nm femto-second laser excitation (2 mJ/pulse and fwhm = 130 fs). Overlaid in green is a simulated spectrum for the conversion 3 → CuI + CuI + O2 based on subtraction of the red spectrum from the black shown in Figure 8a. The probe light is interrupted by the pump laser in the wavelength region around 580 and 630 nm.
