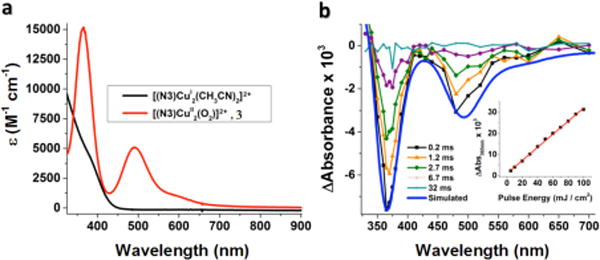
Figure 8.

(a) Absorption spectrum of 3 (red line) obtained from oxygenation of [(N3)CuI2]2+ (black line) in acetone at −80 °C. (b) Transient absorption difference spectra collected at the indicated delay times after 532 nm laser excitation (10 mJ/pulse, 8–10 ns fwhm) of 3 in acetone at −80 °C. Overlaid in blue is a simulated spectrum based on subtraction of the red spectrum from the black in (a). The inset in (b) shows the magnitude of the absorption change as a function of the incident irradiance.
