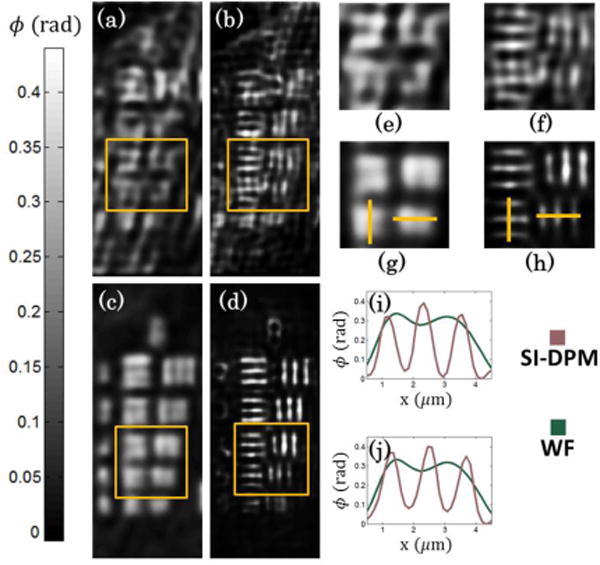
Fig. 2.

Quantitative phase images using (a,b) laser illumination and (c,d) broadband illumination. (a,c) Diffraction-limited images are also compared to (b,d) enhanced resolution images. (e,f,g,h) Close-ups of Group 8 El 4–5 from (a,b,c,d) respectively. (i,j) vertical and horizontal cross cuts from diffraction-limited (WF) and SI-DPM images in (g,h), respectively.
