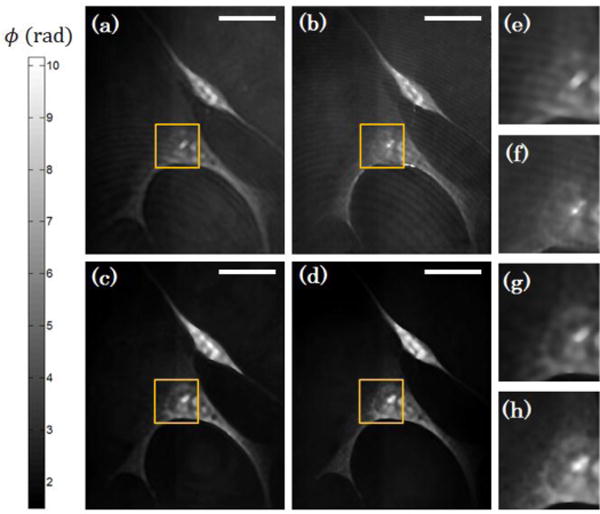
Fig. 3.

Quantitative phase images of endothelial progenitor cells using (a,b) broadband and (c,d) laser illumination. (a,c) Diffraction-limited images are also shown and compared to (b,d) sub-diffraction resolution images. Insets outlined in yellow shown in (a,b,c,d) are magnified and shown in (e,f,g,h), respectively. Scale bar on top right corresponds to 10 μm.
