
Fig. 4.
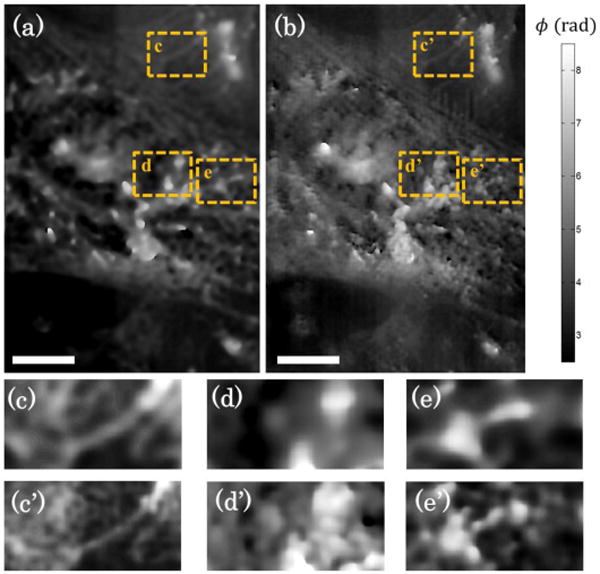
Quantitative phase images of mesenchymal stem cells using broadband illumination are shown. (a) Diffraction-limited images are compared to (b) sub-diffraction resolution images. Select regions-of-interest are compared between the (c,d,e) diffraction-limited image and (c’,d’,e’) sub-diffraction resolution image. Scale bar on bottom left corresponds to 5 μm