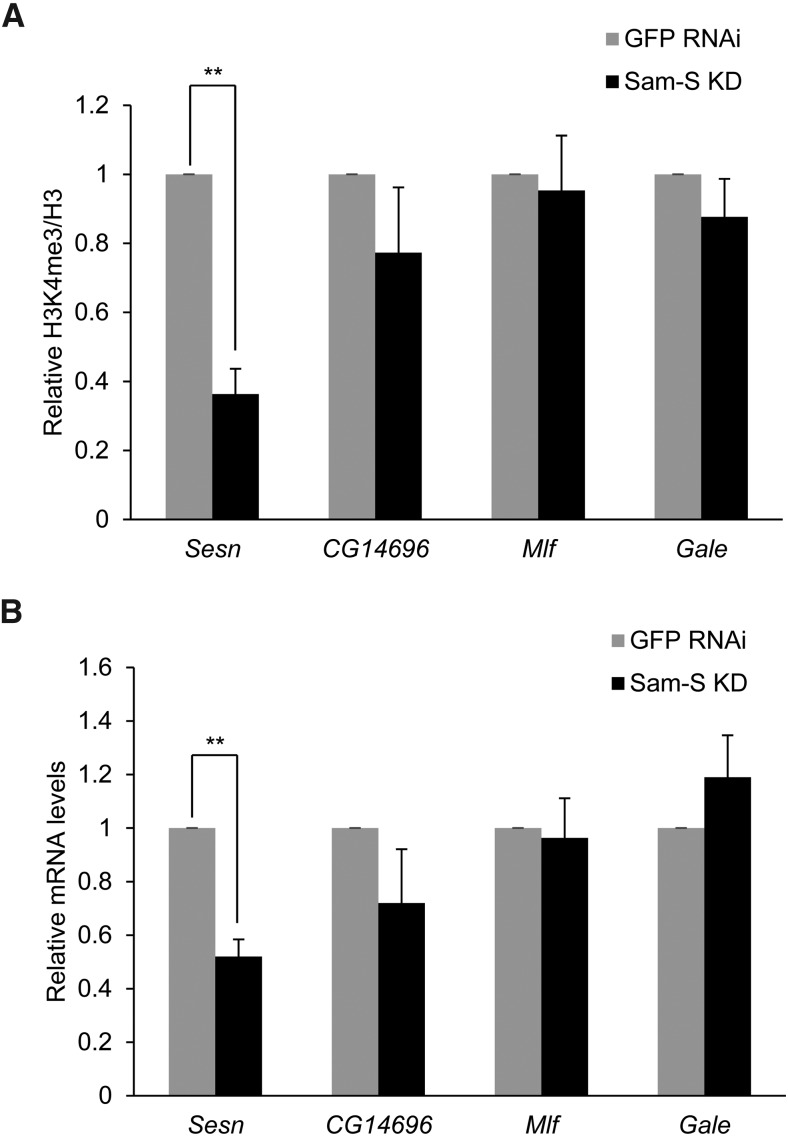
Figure 6.
Knockdown of Sam-S affects gene specific H3K4me3 levels and gene expression. (A) ChIP-qPCR analysis of H3K4me3 levels at selected genes in GFP RNAi control and Sam-S deficient cells. Real-time quantitative PCR analysis was performed using chromatin prepared from RNAi-treated S2 cells immunoprecipitated with antibody to H3K4me3 or H3. H3K4me3 levels were normalized to histone H3 at specific genes. Relative H3K4me3 signals were calculated by dividing normalized H3K4me3 levels in Sam-S deficient cells by the levels in GFP RNAi control. Results are the average of three biological replicates. Error bars represent standard error of the mean. Statistically significant results are indicated. (B) Expression of selected genes in GFP RNAi control and Sam-S deficient cells. Taf1 was used to normalize expression levels. The relative mRNA was calculated by dividing normalized gene expression levels in Sam-S deficient cells by the levels in GFP RNAi control. Results are the average of three biological replicates. Error bars represent standard error of the mean. Statistically significant results are indicated. (**) P < 0.01.

