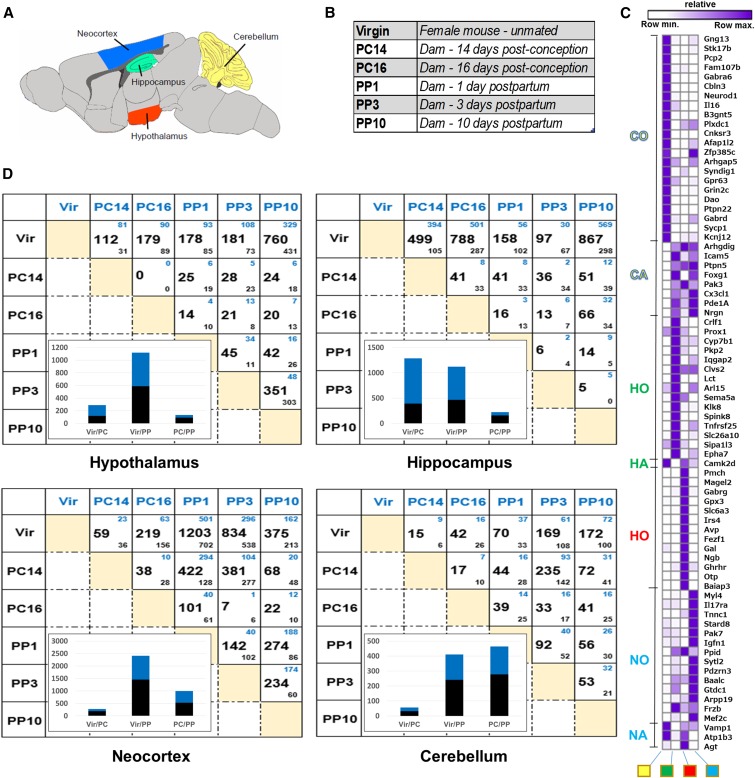
Figure 1.
Transcriptome analyses of four regions of the mouse brain. (A) The four brain regions examined are: cerebellum (yellow); hippocampus (green); hypothalamus (red); and neocortex (blue). (B) Overview of the research design with six different stages examined: virgin females, two postconception (PC) stages, and three postpartum (PP) stages. (C) Hierarchical clustering of genes from literature survey and the Allen Brain Atlas data to check for region specificity of gene expression. The expected expression is indicated on the left of the cluster, as follows: cerebellum only (CO; yellow), cerebellum absent (CA; yellow), hippocampus only (HO; green), hippocampus absent (HA; green), hypothalamus only (HO; red), neocortex only (NO; blue), and neocortex absent (NA; blue). Columns are labeled at the bottom, from left to right: cerebellum (yellow square), hippocampus (green square), hypothalamus (red square), and neocortex (blue square). In the cluster, purple indicates row maximal expression, and white indicates row minimum expression. (D) Number of significant differentially expressed genes for each pairwise comparison (FDR corrected p value <0.05). Genes higher in the condition in blue (column labels) or black (row labels) are indicated by smaller blue and black numbers, respectively. Insets show the number of genes that are higher (blue) or lower (black) in virgin (Vir) and PC comparisons (Vir/PC), virgin and PP comparisons (Vir/PP), and PC and PP comparisons (PC/PP), respectively.

