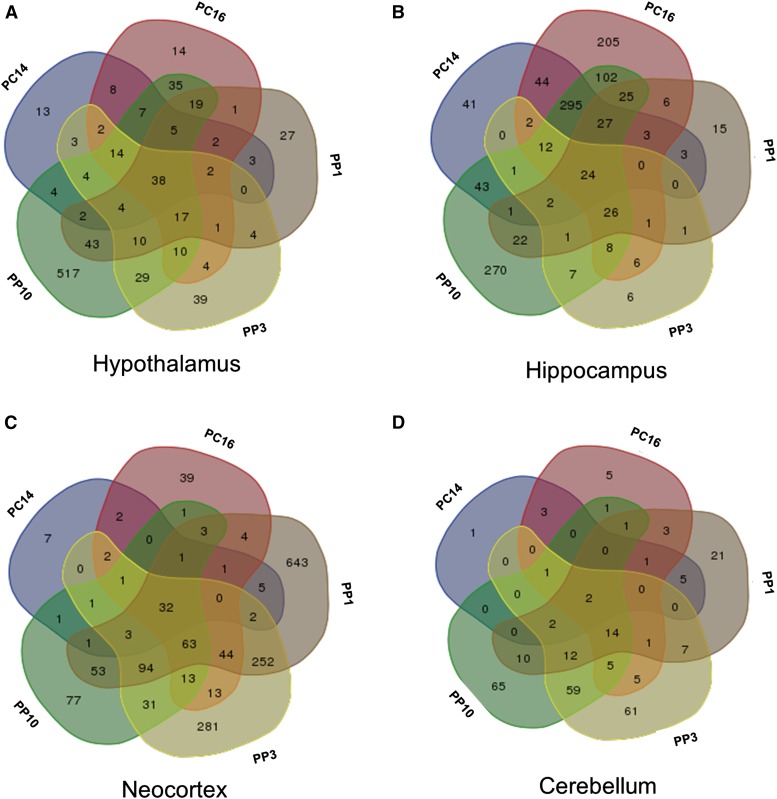
Figure 4.
Time points have distinct and overlapping sets of differentially expressed genes. Overlap of the differentially expressed genes in each virgin pairwise comparison to PC and PP stages in the (A) hypothalamus, (B) hippocampus, (C) neocortex, and (D) cerebellum. The Venn diagram was made using an online tool (http://bioinformatics.psb.ugent.be/webtools/Venn/).

