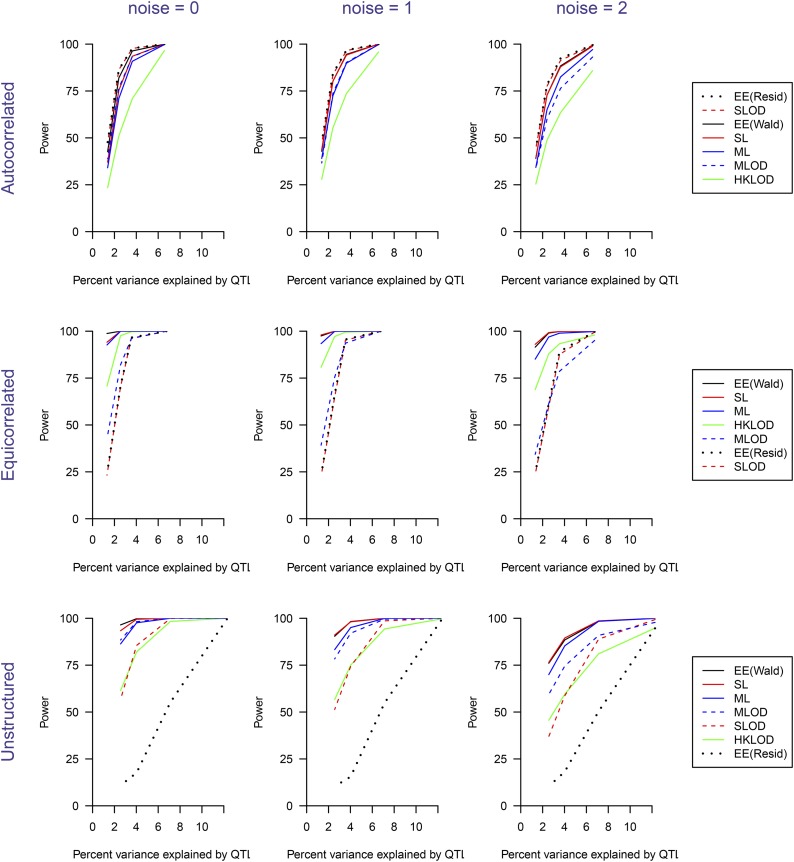
Figure 5.
Power as a function of the percent phenotypic variance explained by a single QTL, with additional noise added to the phenotypes. The first column has no additional noise; the second and third columns have independent normally distributed noise added at each time point, with standard deviation 1 and 2, respectively. The percent variance explained by the QTL on the x-axis refers, in each case, to the variance explained in the case of no added noise. The three rows correspond to the covariance structures (autocorrelated, equicorrelated, and unstructured). In the legends on the right, the methods are sorted by their overall average power for the corresponding covariance structure.

