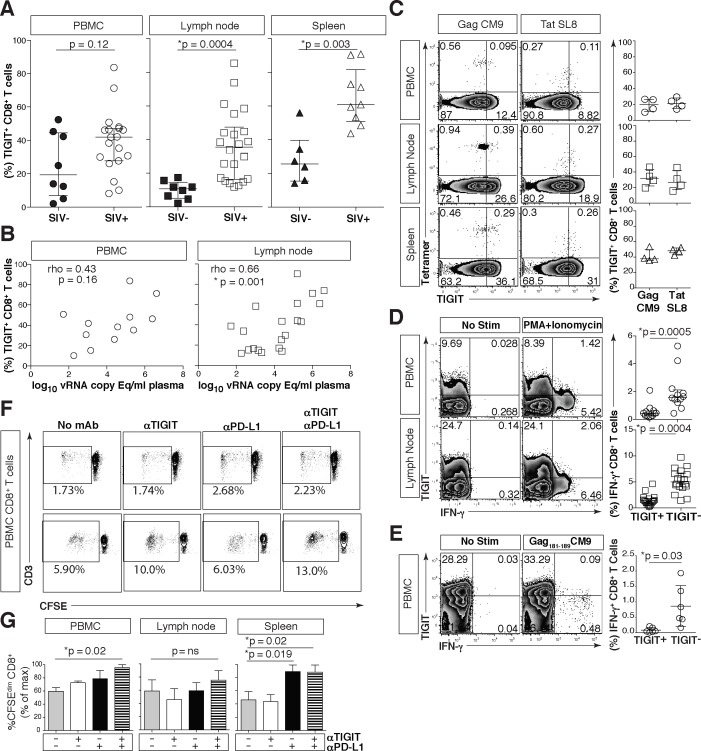
Fig 7. Phenotypic and functional assessment of rhTIGIT expression on CD8+ T cells.
Cryopreserved rhesus macaque PBMCs were thawed, phenotyped and assessed for function. (A) Graphs show frequency (%) of rhTIGIT+CD8+ T cells from PBMCs (circle), LNs (square), and spleen (triangle) in SIV-uninfected (filled) and SIV-infected (open) animals (SIV-uninfected PBMCs, n = 8; SIV-infected PBMCs, n = 19; SIV-uninfected LNs, n = 8; SIV-infected LNs, n = 22; SIV-uninfected spleen, n = 6; SIV infected spleen, n = 9). P values were calculated with Mann-Whitney U tests. (B) Graphs show correlation of frequency (%) of rhTIGIT+ CD8+ T cells in PBMCs (circle) and lymph nodes (square) from SIV-infected animal against plasma SIV viral load log10 vRNA copy Eq/ml (PBMCs, n = 12; LNs, n = 20). vRNA copy Eq, viral RNA copy equivalents. Spearman’s rho tests were performed for correlations. (C) Representative flow cytometry plots of tetramer stains for Mamu-A*01 restricted SIV-Gag CM9 and SIV-Tat SL8 specific CD8+ T cells from PBMC, LNs, and spleen, in a representative Mamu-A*01 animal with full cART suppression. Compiled data of rhTIGIT expression frequency (%) on tetramer specific CD8+ T cells (n = 4) from PBMCs (circle), LNs (square), and spleen (triangle) from Mamu-A*01+ macaques with full cART suppression. (D) Representative flow cytometry plots of PBMCs (n = 12) or lymph nodes (n = 18) stimulated without or with PMA + Ionomycin. Graphs show frequency (%) of IFN-γ from CD8+ T cells expressing TIGIT or not expressing TIGIT. P values were calculated by Wilcoxon matched-pairs signed ranked test. (E) Representative flow cytometry plots of PBMCs from a Mamu-A*01+ macaque stimulated without or with SIV-Gag181-189 CM9 peptide. Graph shows frequency (%) of IFN-γ from SIV-Gag181-189 CM9-specific CD8+ T cells expressing TIGIT or not expressing TIGIT from Mamu-A*01+ macaques (n = 6). P values were calculated by Wilcoxon matched-pairs signed ranked test. (F) Representative flow cytometry plots of CD8+ T cells from two separate SIV-infected macaques showing CD8+ T cell CFSE dilution in response to AT2-inactivated SIV with either no antibody, anti-TIGIT, anti-PD-L1 or dual blockade (anti-TIGIT + anti-PD-L1). (G) Graphs show compiled data of CD8+ T cell CFSE dilution from PBMC (left panel), Lymph node (middle panel), or Spleen (right panel) as percent of max (n = 4). P values were calculated by Wilcoxon matched-pairs signed ranked test.

