Fig. 1.
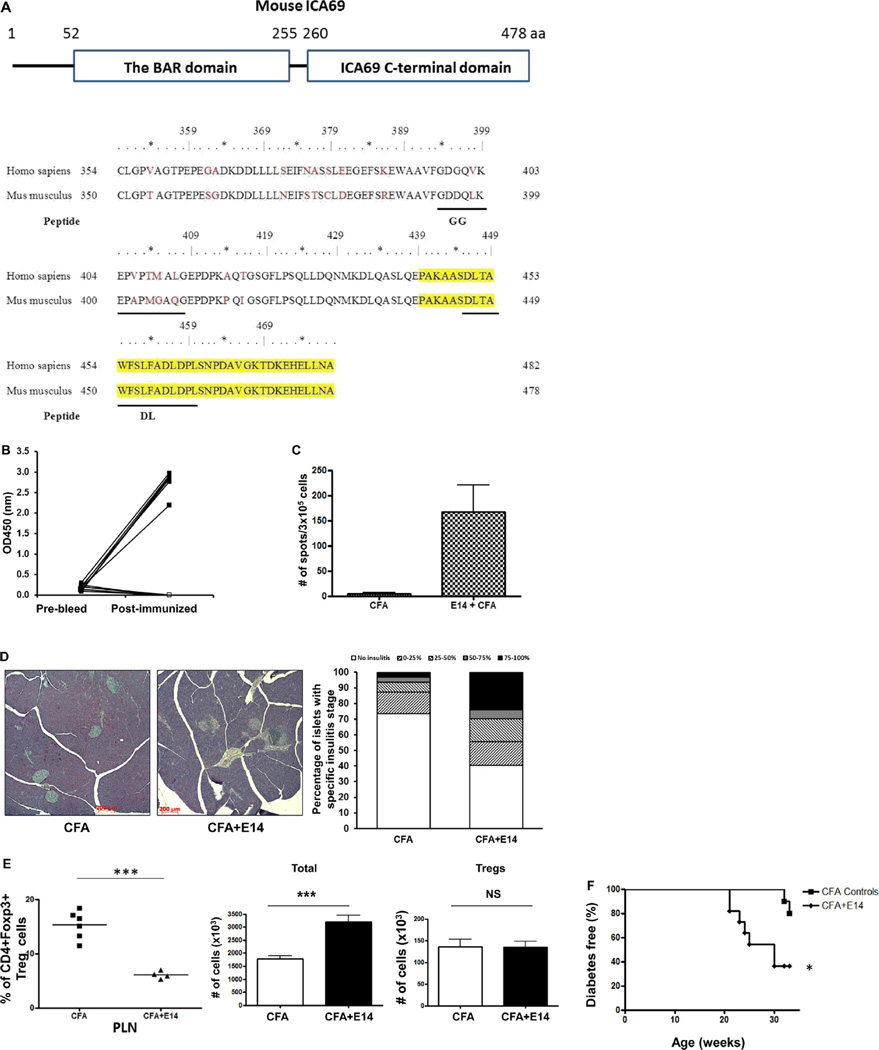
Diabetes progression in NOD mice immunized with E14 polypeptides. A. Top panel, schematic view of the conserved domains of the mouse ICA69 protein: the N-terminal Bin/Amphiphysin/Rvs (BAR) domain and the C-terminal ICA69 C-terminal domain (CTD). The amino acid (aa) position of each domain is listed on top. Lower panel, sequences of amino acids encoded by exons 13 and 14 of the mouse and human Ica1 genes. Amino acids encoded by exon 14 are marked yellow. Other peptides used in this study (GG and DL) are underlined. B. Eight week old female NOD mice were immunized with CFA + E14 (filled-square) or CFA alone (open-square). Serum samples were harvested 4-weeks post-immunization, and were compared to those of pre-bleed. Levels of anti-E14 seroreactivities were determined with ELISA-based, colorimetric assay. C. Eight week old female NOD mice were immunized with either CFA + E14 (n = 5) or CFA (n = 5) as controls and the presence of IFNγ-producing cells in the spleens were determined with ELISPOT 4-weeks post-immunization. Splenocytes were stimulated with E14 and the assays were run in triplicates. D. Image analysis of insulitis severity. Left panel, representative histological sections (H&E) of pancreata harvested from 12-weeks old NOD mice after immunization with either CFA (n = 5, left image) or CFA + E14 (n = 5, right image) for 4-weeks. Right panel, the degree of insulitis of each islet was assigned a score, based on the percentage of islet area occupied by infiltrates. No insulitis, 1; 0–25%, 1; 25–50%, 2; 50–75%, 3; 75–100%, 4. The bar graphs show the percentage of islets with 0–4 insulitis scores in CFA and CFA + E14 treated mice. E. Percentages of CD4+Foxp3+ Treg cells in CD4+ T-cells of pancreatic lymph nodes (PLN) (left panel) were analyzed with flow cytometry (FCM). The numbers of Treg cells (right panel) in PLNs of E14 immunized mice (black bar, n = 4) and CFA treated controls (unfilled bar, n = 6) were calculated based on the total numbers of T-cells isolated (middle panel). ***, p < 0.001; NS, not significant. F. Diabetes progression of CFA-treated (n = 14) and CFA + E14 immunized NOD mice (n = 14). Mice were immunized at 8-weeks of age and followed till 32-weeks of age. *, p < 0.05.

