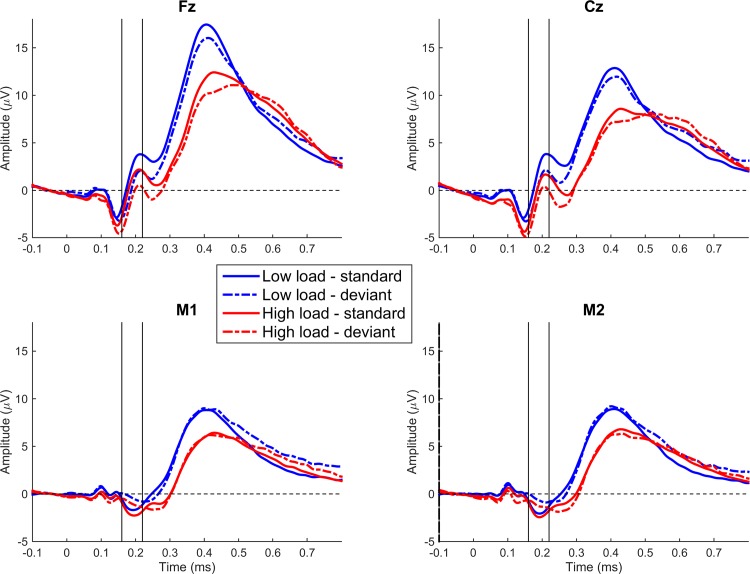
Fig 2. Grand mean (N = 28) ERP waves (referenced to tip of nose) after tone onset for the relevant electrodes, separately for the four conditions (Deviance x Load).
For visualization purposes only, the ERPs were low-pass filtered (30 Hz, 6 dB roll-off, Butterworth). The interval between 160 and 220 ms after tone onset was used to capture the mismatch negativity.

