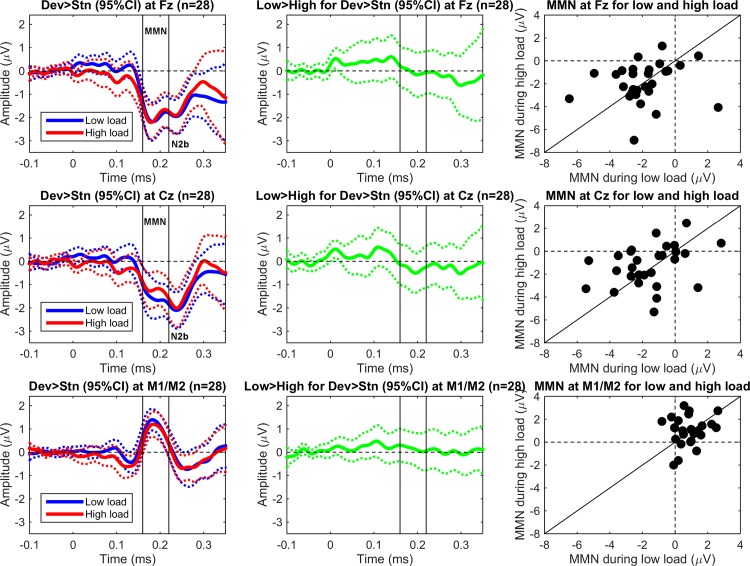
Fig 3. Grand mean (N = 28) ERP difference waves (deviant minus standard, referenced to tip of nose) after tone onset at Fz (top), Cz (middle), and mastoids (bottom) for low and high perceptual load (left), the subsequent difference of low load minus high load (middle), and a scatterplot of individual mean MMN amplitudes (i.e., deviant minus standard) for low and high load (right).
For visualization purposes only, the ERPs were low-pass filtered (30 Hz, 6 dB roll-off, Butterworth).

