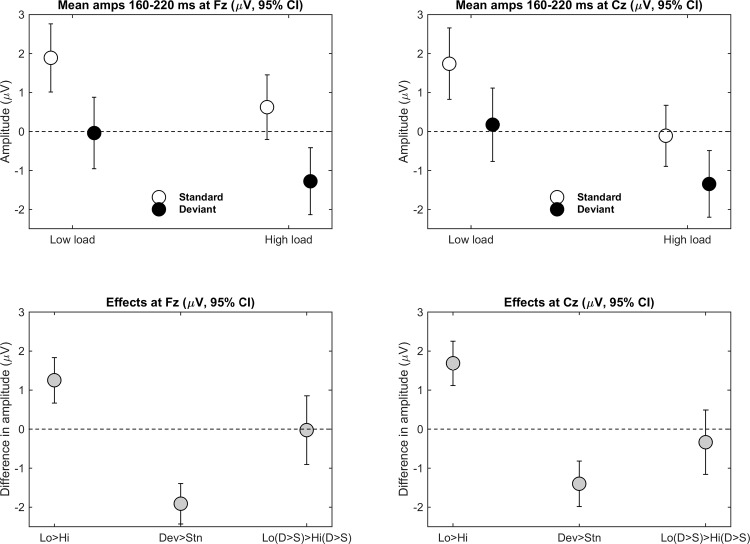
Fig 4. Mean amplitudes (referenced to tip of nose) for the four conditions (Deviance x Load) across 160–220 ms after tone onset at Fz (left) and Cz (right).
The top row shows condition means (95% CI for each variable), and the bottom row shows mean difference scores (95% CI for the differences) between conditions for effects of load (low minus high), tone deviance (deviant minus standard), and the interaction (i.e., [deviant–standard at low load]–[deviant–standard at high load]).

