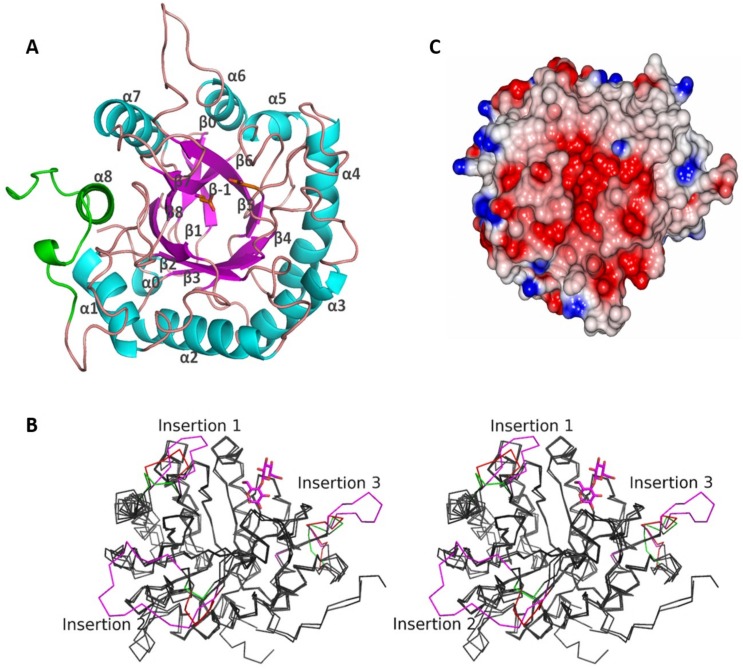
Fig 5. The structure of CelDZ1.
(A) Folding of the CelDZ1α monomer is presented as a cartoon diagram and viewed from the solvent region towards the active site groove formed by the C-terminal ends of the β-strands of the (β/α)8-barrel. The α-helices, β-strands and loops are coloured in turquoise, magenta and pink, respectively. The carbohydrate-binding module (Fig 1), which contains helix α8 at the C terminus, is highlighted in green. The two catalytic residues are shown as stick models and secondary structural elements are labelled. The Met50 indicates the position of the first N-terminal residue defined in the electron density. The image was prepared using PyMol [40]. (B) A stereo representation of the superimposition of the monomers of CelDZ1, CelK and Cel5a displayed as grey carbon traces. The three different insertion regions are highlighted in red for CelDZ1, magenta for CelK and green for Cel5a. The cellobiose ligand bound to CelK is shown as a magenta stick model. The image was prepared using PyMol [40]. (C) The electrostatic potential surface of the CelDZ1 enzyme around the active site groove as viewed from the solvent region. The positive charge is shown in blue and the negative charge is shown in red. The extended active site groove, which crosses the monomer from left to right, is negatively charged disfavoring the binding of halogen ions thereby increasing halotolerance. The image was prepared with ccp4mg [41].

