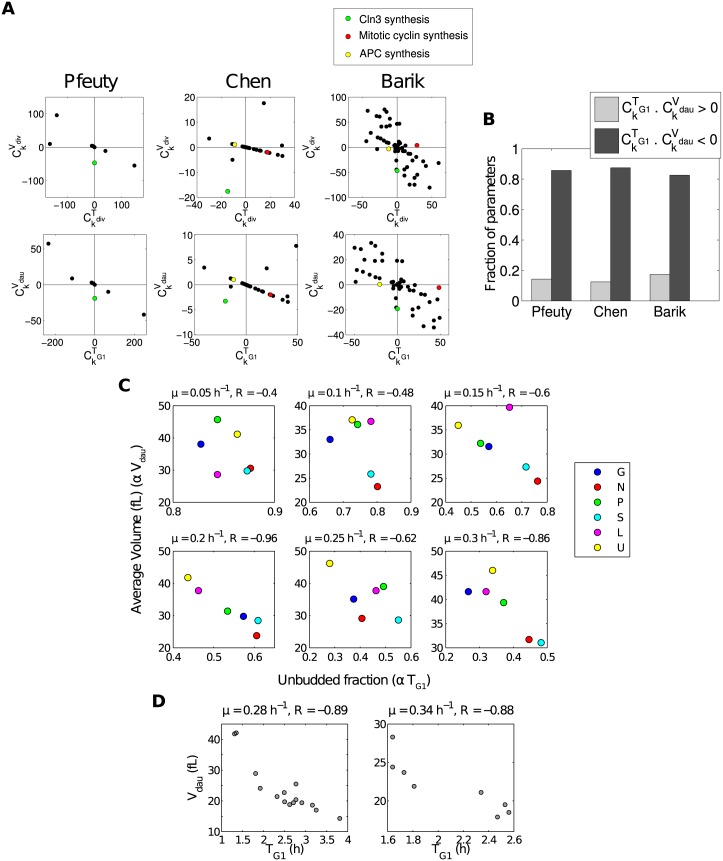
Fig 2. Consistent pattern of parameter sensitivities across models and experimental data.
(A) Parameter sensitivities of V div, V dau, T div, and T G1 across all three models under constant conditions (i.e. basal parameter values). (B) Proportions of parameters for which the sensitivities of V dau and T G1 have the same sign (light bars) and opposite sign (dark bars). (C) Negative correlation between average volume and unbudded fraction for cells grown at constant rate under different limiting nutrients (i.e. limiting glucose (G), nitrogen (N), phosphate (P), suphur (S), leucine (L), and uracil (U)). Data from [12]. (D) Negative correlation between V dau and T G1 for cells grown at constant rate under different nutrient and genetic perturbations. Data from [46].

