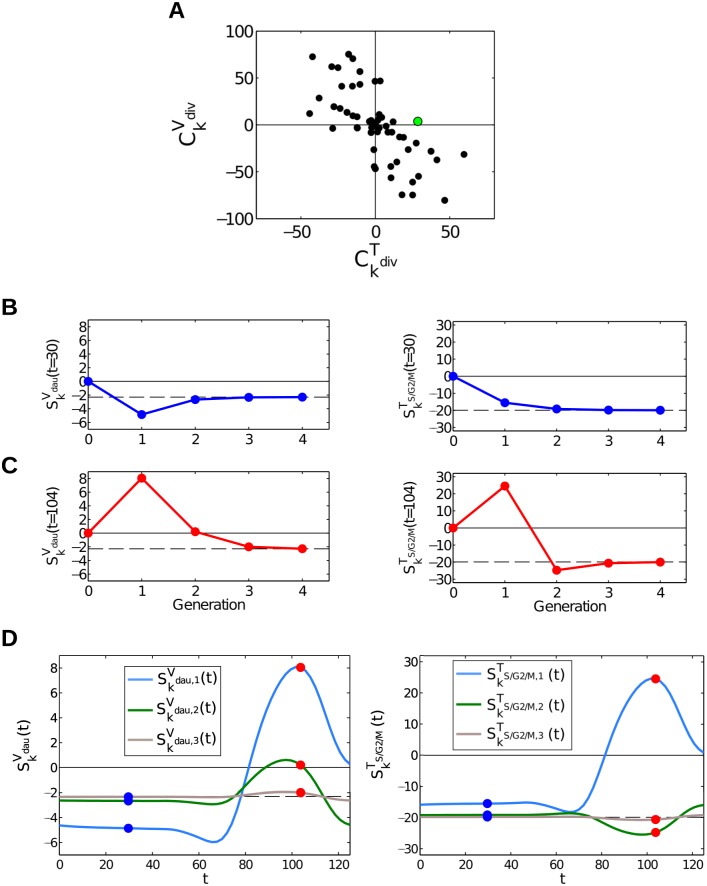
Fig 3. Example dynamic sensitivity analysis of the mitotic cyclin synthesis parameter in the Barik model (k s,bM).
(A) and for all parameters in the Barik model, with the parameter representing mitotic cyclin synthesis marked in green. (B) Sensitivity of V dau and T S/G2/M for four generations following a step-change in parameters applied at 30mins. (C) As in (B), for a step-change in parameters applied at 104mins. (D) and down generations as functions of time. Points from (B,C) are marked by blue and red circles, respectively. Vertical dashed lines represent the time of the G1-S transition.

