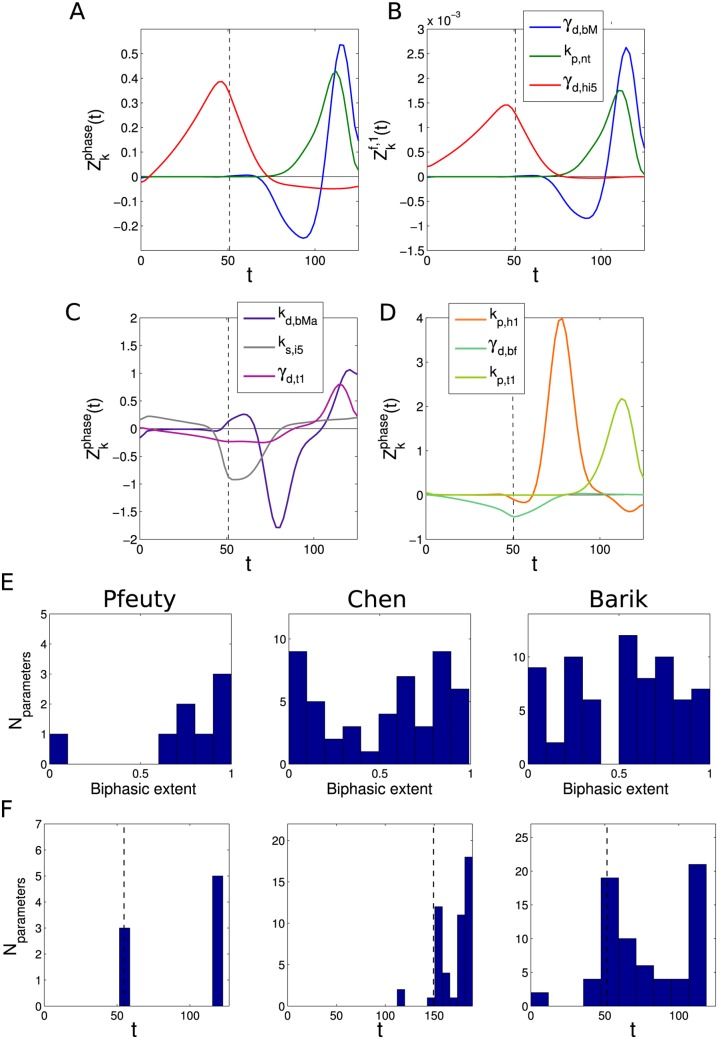
Fig 5. Consistent phase responses across models.
(A) Phase responses for three exemplar parameters in the Barik model. (B) Sensitivity of the fraction of cell volume donated to the daughter cell for the three parameters shown in (A). The high similarity of the functions in (A) and (B) follows from the correspondence between phase shifts and daughter cell size fraction (Eq 14). (C,D) Examples of predominantly biphasic (C) and monophasic (D) phase response curves for parameters in the Barik model. (E) Distribution of biphasic extent of parameters for all three models, evaluated according to Eq (15). (F) Distribution of peak phase sensitivities for all three models. Vertical dashed lines represent the time of the G1/S transition.

