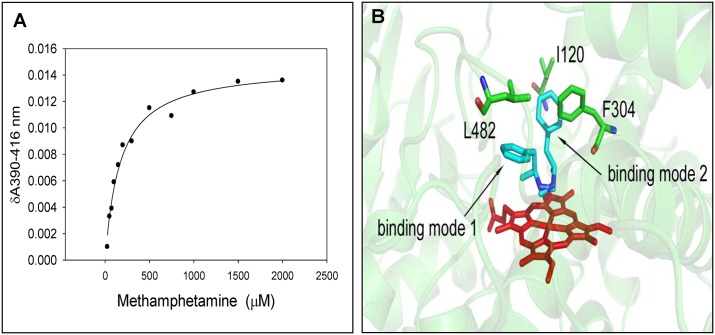
Fig 2. Spectral binding of methamphetamine with CYP3A4.
(A) The spectral binding was performed at varying concentrations of methamphetamine from 1 μM to 2 mM. The graph was plotted using difference in absorbance at 390 and 416 nm vs. concentration of methamphetamine. The graph was fitted with hyperbolic equation using non-linear regression analysis in sigma plot 11. (B) Docking simulation of methamphetamine binding with CYP3A4 in two different binding modes. The heme, methamphetamine, and interacting amino acid residues of CYP3A4 are represented in red, green, and blue, respectively.

