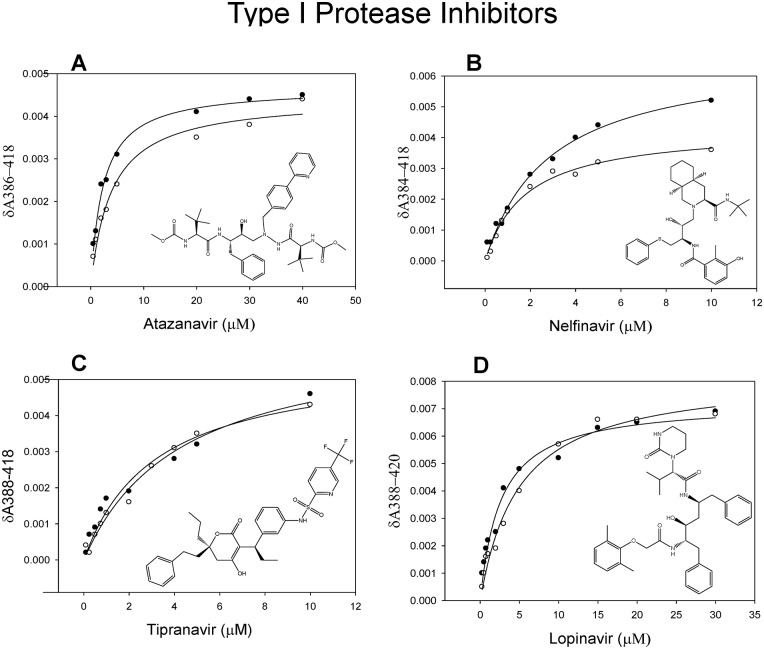
Fig 3. Spectral binding of type I PIs with CYP3A4 in the absence (filled circles) and presence (open circles) of methamphetamine.
(A-D) The spectral binding was performed at varying concentrations of atazanavir, nelfinavir, tipranavir and lopinavir. The KD and δAmax for each PI with and without methamphetamine are presented in Table 2. One way ANOVA with Dunnet’s post-hoc test was employed to calculate the statistical significance. A p-value <0.05 is indicated by * and <0.1 is indicated by #.

