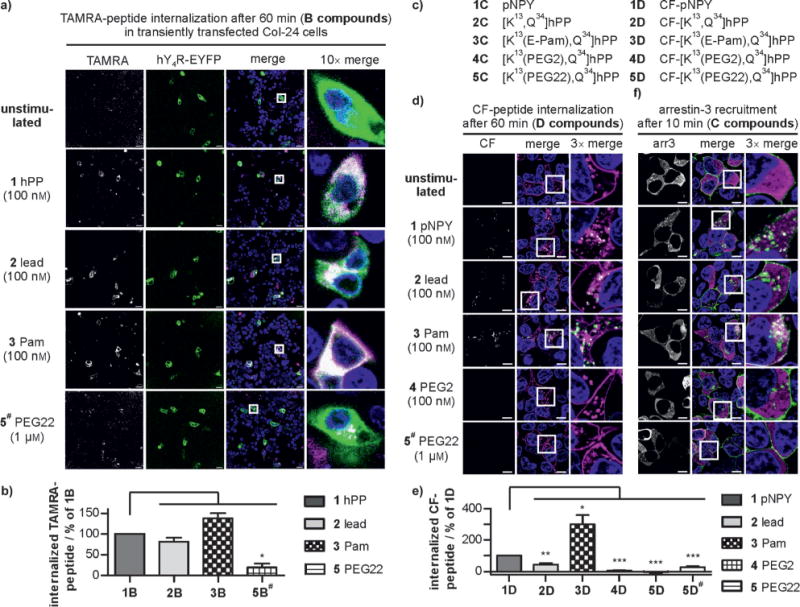
Figure 6.

a) Live-cell images and b) quantification of ligand uptake (magenta) after 60 min exposure in Col-24 cells transiently transfected with hY4R (green). Scale bar: 20 μm. c) Porcine NPY (pNPY) and modified [K13,Q34]hPP analogues. Imaging (d) and quantification (e) of the hY2R-mediated (magenta) internalization of CF compounds (green) after 60 min stimulation. f) Arr3 distribution (magenta) after 10 min stimulation of hY2R (green) in transiently transfected HEK293 cells. Scale bar: 10 μm. Peptide concentration: 100 nM, except for 5B# and 5D# (1 μm).
