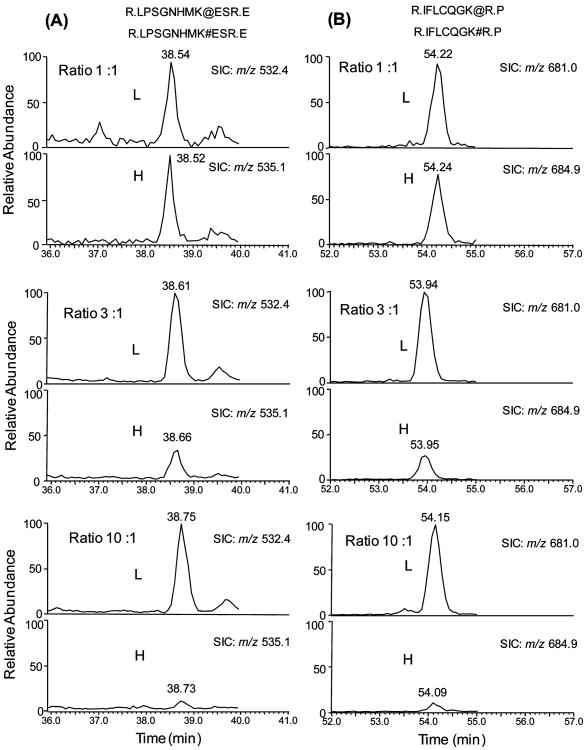
Figure 1.
Evaluation of the quality of quantification based on SILAC and biotinylated peptides. Selected-ion chromatograms (SICs) of two pairs of light (L) and heavy (H) biotinylated peptides of MCAM from WM-266-4 cells. The expected ratios of peak area of light and heavy peptides are 1:1, 3:1, and 10:1 from top panel to bottom panel. The biotinylated light lysine ([12C6,14N2]-l-lysine) and heavy lysine ([13C6,15N2]-l-lysine) are labeled with “#” and “@”, respectively. (A) SICs of the [M + 3H]3+ ions of LPSGNHMK#ESR (m/z 532.4) and LPSGNHMK@ESR (m/z 535.1); (B) SICs of the [M + 2H]2+ ions of IFLCQGK#R (m/z 681.0) and IFLCQGK@R (m/z 684.9), in which the cysteine residue is CAM-modified. The calculated ratios of peak area of these peptides are listed in Table 1.

