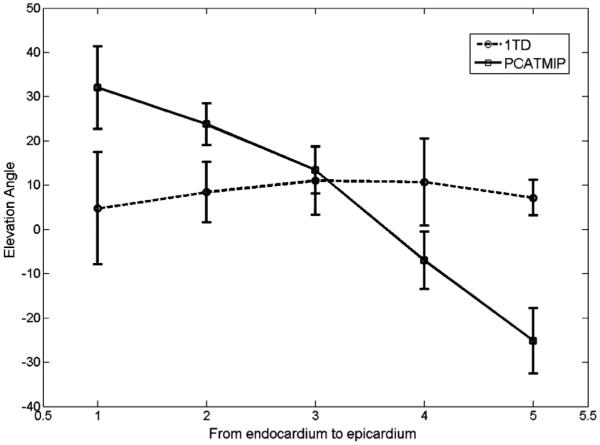
Fig. 10.

Elevation angle values obtained without (1TD, dotted line) and with the PCATMIP (solid line) method from the endocardium to epicardium of the LV. The x value (from 1 to 5) in the plot represents five different transmural locations (endocardium, mid-endocardium, mid-wall, mid-epicardium, and epicardium layers, respectively). Error bars represent the standard deviations in each dataset.
