
Fig. 11.
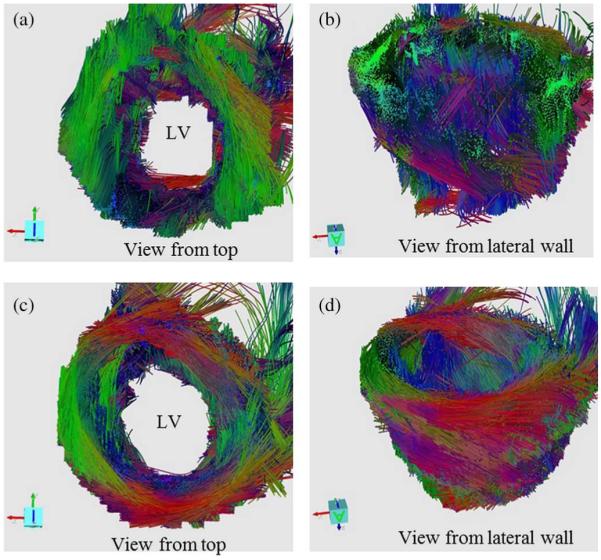
In vivo 3-D fiber tracts of a volunteer derived from 1TD [(a) and (b)] and PCATMIP [(c) and (d)]. The 3-D fiber architectures were constructed from 10 slice DW images. The red, green, and blue colors of the tracked fibers indicate the x, y, z components of the local orientation of the fiber, respectively.