
Fig. 5.
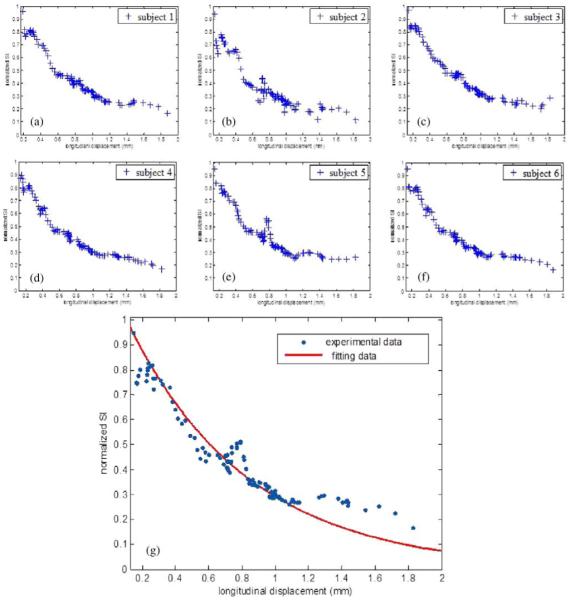
Normalized myocardial DW SI as a function of cardiac motion for the six volunteers corresponding to (a)–(f) and the cardiac motion model over the six volunteers (g). Blue points in (g) represent experimental data: for each blue point, the x value indicates the relative longitudinal displacement amplitude and the y value indicates the measured SI derived from all pixels averaged inside each of the six AHA ROIs. Red curve in (g) represents the fitted data.