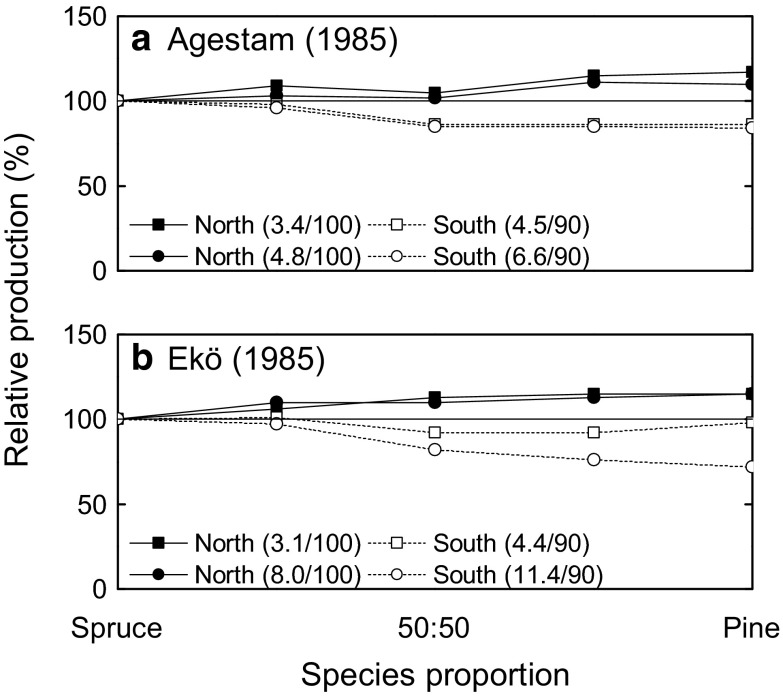
Fig. 3.
Relative stem volume production for mixtures and pure stands of Norway spruce and Scots pine from simulations which consider the whole rotation, by a Agestam (1985) and b Ekö (1985). Relative production (%) is presented in relation to pure spruce. The figure shows separate simulations for the northern and southern parts of Sweden (a, b) and for different site fertility classes (MAI (m3 ha−1 year−1) for pure spruce and rotation length (years) within brackets)

