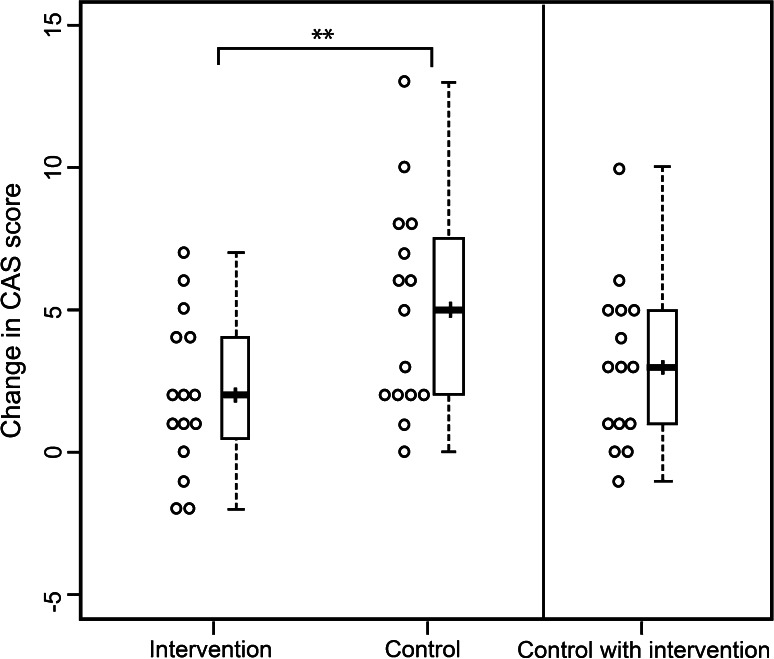
Fig. 2.
Change in findings of self-evaluation of antiemetic-induced constipation. The 2 boxes on the left indicate the score after the first cycle of chemotherapy (C1), as adjusted by the baseline score (C1-baseline). The mean change in the constipation assessment scale (CAS) was significantly lower in the intervention group than in the control group [mean, 2.0 vs. 5.0; 95 % confidence interval (−5.46 to −0.54); **P = 0.019, t test]. The box on the right indicates the score after the second cycle of chemotherapy (C2), as adjusted by the baseline score (C2-baseline) in the control group (waiting-list control C1 without intervention in the hospital; C2 with intervention via out-patient care)

