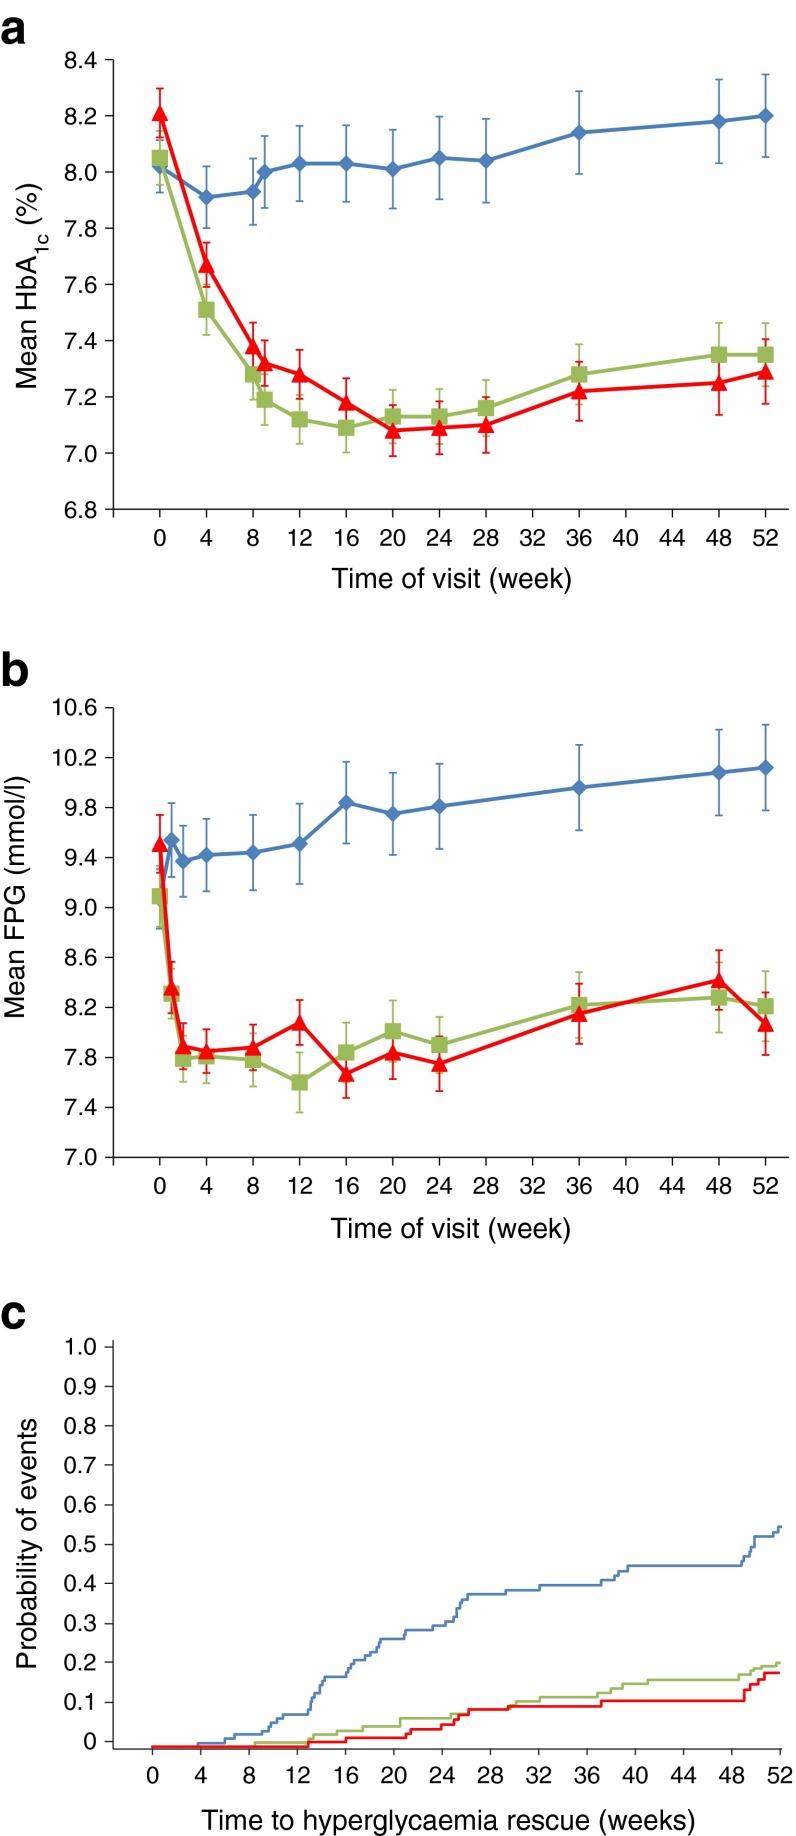
Fig. 2.
(a, b) Mean change in HbA1c (a) and FPG (b) from baseline through to week 52. Data are means ± SEM. Blue diamonds, placebo (n = 99); green squares, albiglutide 30 mg (n = 100); red triangles, albiglutide 50 mg (n = 97) uptitration at week 12. To convert values for HbA1c in DCCT % into mmol/mol, subtract 2.15 and multiply by 10.929. (c) Kaplan–Meier plot of probability of hyperglycaemic rescue. Blue line, placebo; green line, albiglutide 30 mg; red line, albiglutide 50 mg. HbA1c and FPG analyses were for the ITT population with LOCF; Kaplan–Meier plot of probability of hyperglycaemic rescue was for the ITT population

