Fig. 1.
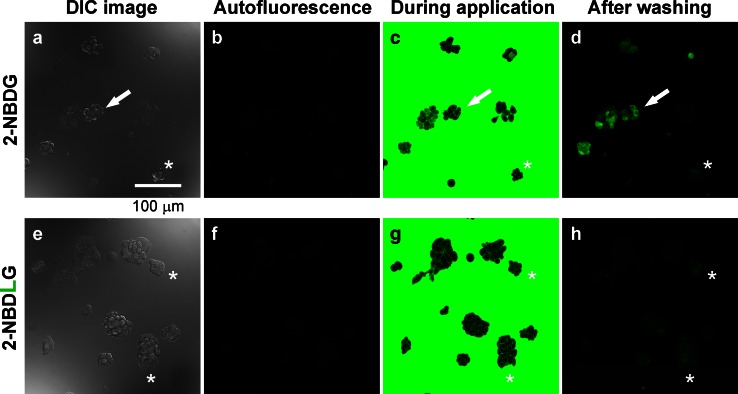
Representative images of MIN6 cell spheroids subjected to a brief application of solution containing either 2-NBDG (a–d) or 2-NBDLG (e–h) at 6 days in vitro (DIV). a Differential interference contrast (DIC) image. b Autofluorescence before application of the fluorescent tracer. c During application of 100 μM of 2-NBDG-containing solution for 3 min. d Fluorescence image taken at 4 min after starting washout of the tracer. 2-NBDG uptake varied considerably from prominent (arrow) to minimal (asterisk) among cells. e–h Similar to a–d but for application of 100 μM of 2-NBDLG to the same series of culture examined on the same day. The uptake of 2-NBDLG into MIN6 cells at this stage was very weak, although some cells showed faint fluorescence (asterisks). Scale bar is common to all images

