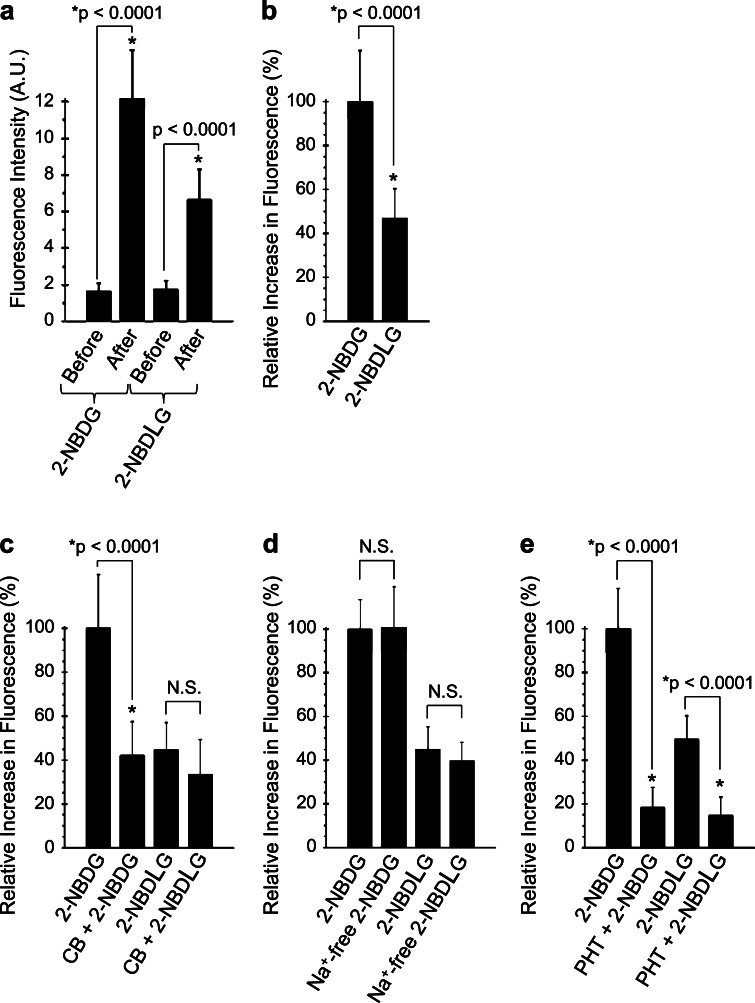
Fig. 3.
Quantitative evaluation of the 2-NBDG and 2-NBDLG uptake into MIN6 cells examined at 10-13 DIV. a Changes in the fluorescence of MIN6 cells subjected to 2-NBDG or 2-NBDLG solution. b The net increase in the fluorescence in (a). c Increase in the fluorescence in the absence or presence of a GLUT inhibitor cytochalasin B (10 μM, CB). d Effect of Na+-free condition on the 2-NBDG and 2-NBDLG uptake. e Effect of phloretin (150 μM, PHT) on the 2-NBDG and 2-NBDLG uptake. Values are expressed as mean percent increase in the fluorescence relative to the fluorescence increase for 2-NBDG application on the same 96-well plate (b–e). Values in individual columns represent mean fluorescence of more than 12 ROIs (more than 5000 cells are included in each ROI) and expressed as mean ± SD

