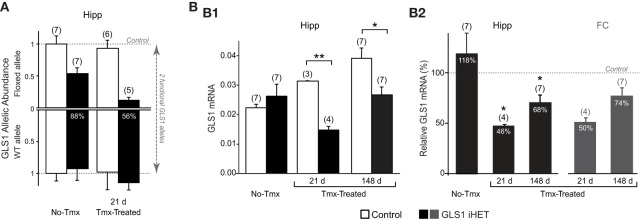
Figure 3.
Induction of GLS1 deficiency in the brain. (A) GLS1 allelic abundance. Wild type (WT) and floxGLS1 (Floxed) allelic abundance in one hippocampus is plotted with respect to the allelic abundance in Control, Tmx-naïve (No-Tmx) mice. In Tmx-naïve GLS1 iHET mice, the floxed allele abundance was 0.54, while in Tmx-treated GLS1 iHET mice this went down to 0.12. The percent reduction in functional allelic abundance is indicated on the bars. (B) Relative GLS1 mRNA expression. (B1) In Tmx-naïve mice (No-Tmx), there was no genotypic difference in GLS1 mRNA expression in the hippocampus, while in Tmx-treated mice, there was a significant main effect of genotype at both time points after Tmx injection (21 days and 148 days). **indicates p < 0.001 *indicates p < 0.05. (B2) mRNA values for the hippocampus (Hipp) in GLS1 iHET mice were expressed as the percentage of control values for each condition (dashed line). There was no reduction in Tmx-naïve mice, whereas in Tmx-treated mice relative mRNA expression was reduced at both 21 and 148 days post-Tmx. *statistically different from No-Tmx GLS1 iHET mice, p < 0.05. The relative mRNA values for the frontal cortex (FC) of Tmx-treated mice (dark gray bars) also showed a similar reduction, to 50 and 74%, 21 and 148 days post-Tmx, respectively.

