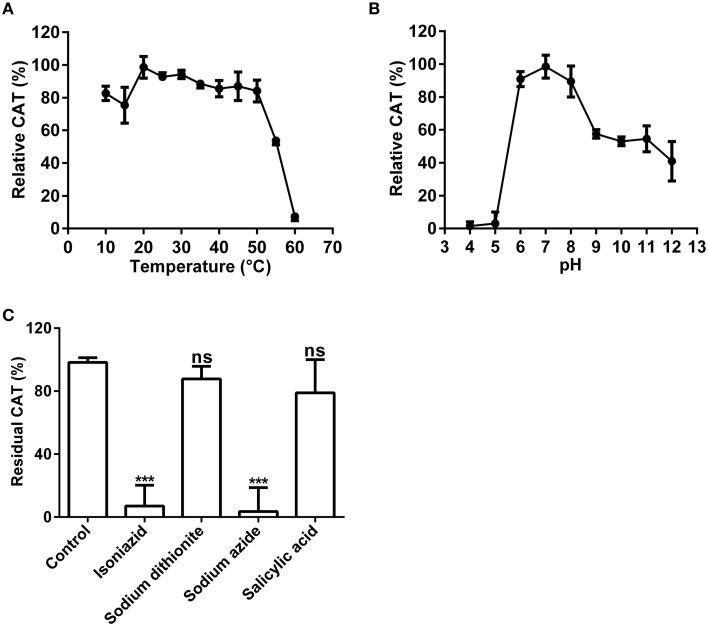
Figure 5.
Biochemical characterization of the catalase activity of the purified enzyme. (A) Optimal temperature of the catalase activity (CAT) of the purified enzyme toward H2O2. (B) Optimal pH of the CAT toward H2O2. (C) Effects of inhibitors (final concentration, 1 mM) on the CAT toward H2O2. The residual CAT was measured by spectrophotometer in the standard reaction mixture with or without (CK) inhibitor (at 1 mM final concentration). Data are from three independent experiments (mean ± SD). Statistical significance was analyzed by Student's t-test with the control; ***P < 0.001; ns, not significant.

