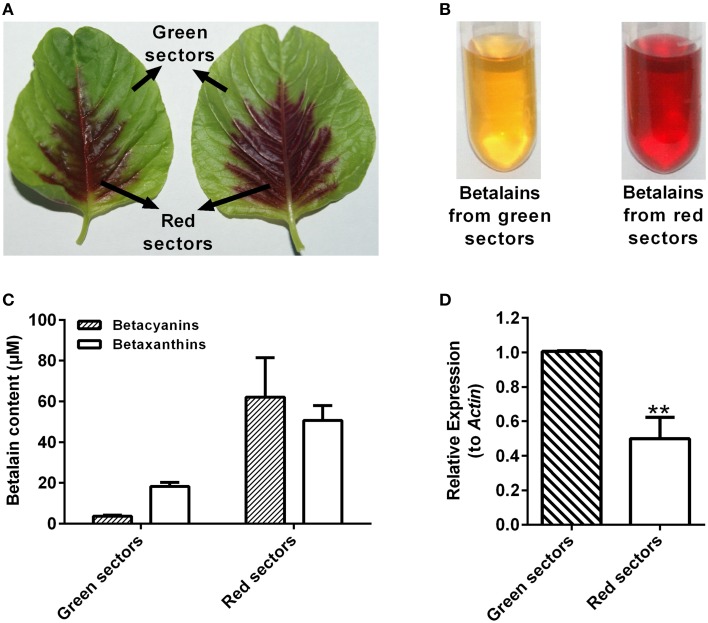
Figure 8.
Betalain pigment analysis and expression levels of AcCATPO in different colored leaf sectors of Amaranthus tricolor. (A) Images depicting different colored leaf sectors of A. tricolor. (B) Images depicting the betalain pigments from green sectors and red sectors. (C) Betalain pigment analysis of green sectors and red sectors. (D) Expression levels of AcCATPO in green sectors and red sectors analyzed by qRT-PCR. These levels were depicted as expression ratios relative to ACT. Three independent experiments were performed, each with three technical replicates. Values are means ± SD (n = 3) from one representative experiment. Asterisk indicates significant difference relative to expression levels of AcCATPO in green sectors (Student's t-test, **P < 0.01).

