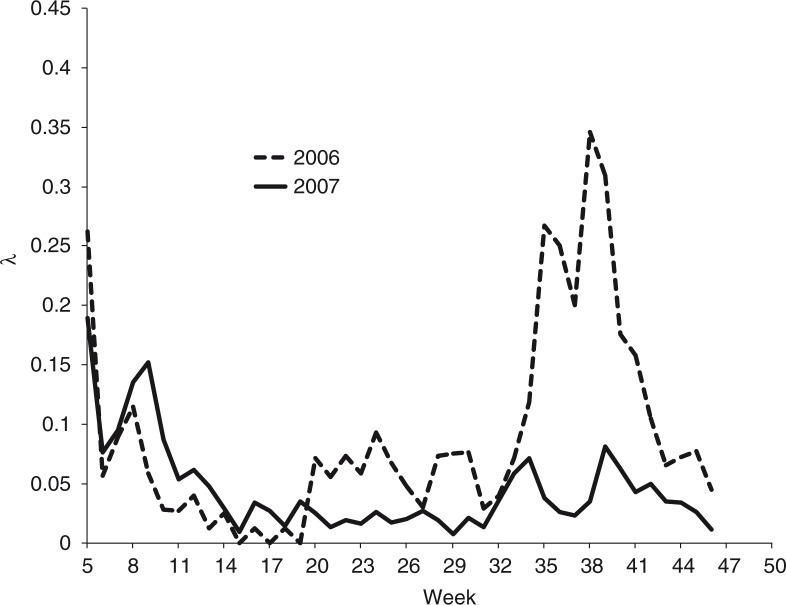
Fig. 6.
The per capita contact rate for the dengue epidemics in the state of Colima during years 2006 and 2007. The per capita contact rate at week t is computed as F(t+1)/F(t)−1, where F(t) is the accumulated incidence at time t. Source: CENAVECE (12).

