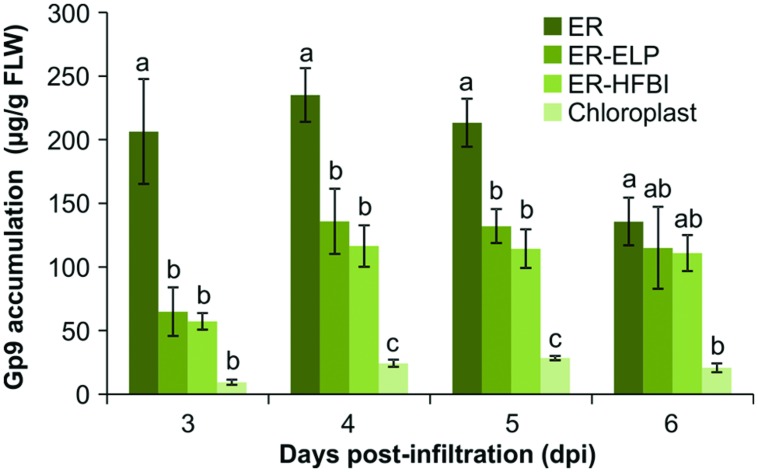
FIGURE 3.
Quantification of Gp9 accumulation in N. benthamiana over 3, 4, 5, and 6 dpi. Quantification was performed on TSP extracts from infiltrated N. benthamiana tissue using a standard curve of known amounts of purified Gp9-ELP. Gp9 was targeted to the ER, the chloroplasts, or the ER fused to an ELP tag (ER-ELP) or fused to a hydrophobin tag (ER-HFBI). Immunoblots were probed with an anti-Gp9 antibody. Accumulation levels of Gp9 are shown in μg per g of FLW. Error bars represent the standard error of the mean value of four biological replicates. Treatments which do not share a letter are significantly different (P < 0.05) as determined by a one way ANOVA and the Tukey test.

