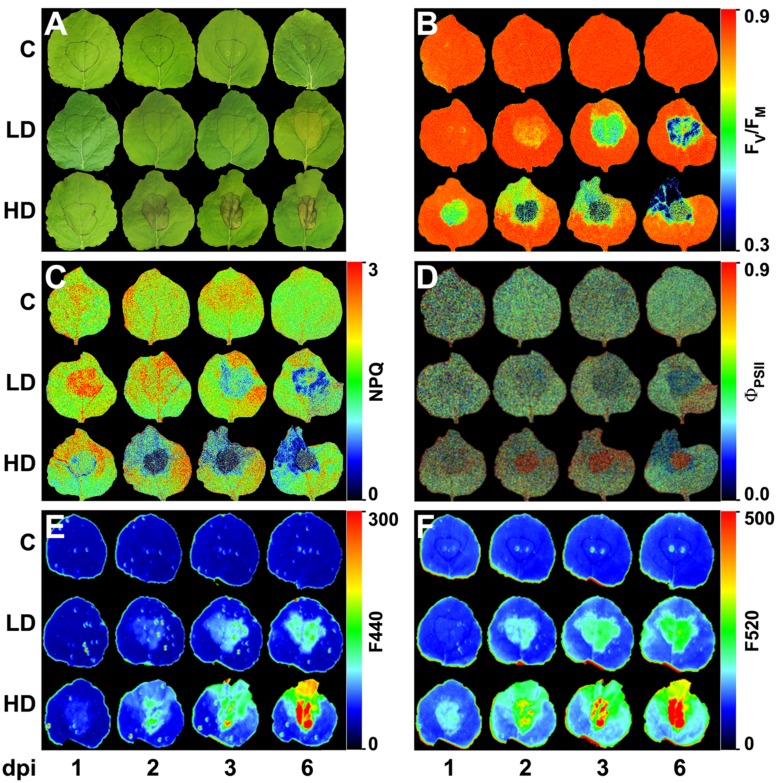
FIGURE 1.
Nicotiana benthamiana leaves inoculated with Dickeya dadantii at a concentration of 104 (LD) or 106 (HD) cfu per ml or mock-inoculated plants (C). Evolution of symptoms (A) and images at different post-infection times of: maximum quantum efficiency of PSII (B), NPQ in the light-adapted steady state (C), quantum efficiency of PSII in the light-adapted steady state (D), and fluorescence at 440 nm (E), and 520 nm (F). The infiltrated area was accurately outlined. The false color-scale used in (B–F) is depicted for each parameter. Images show a representative measurement.

