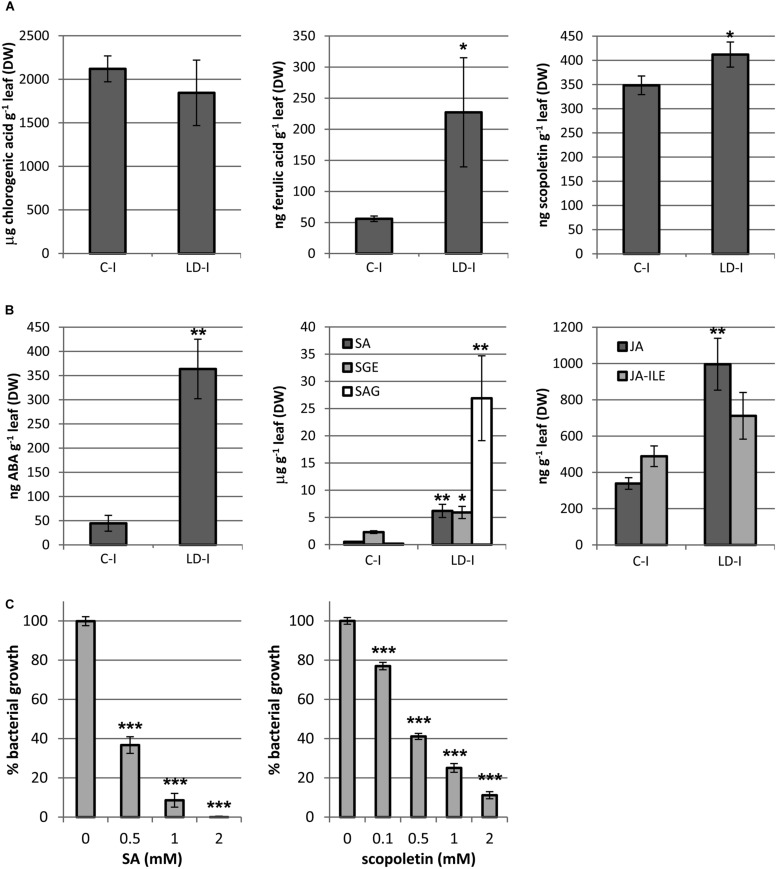
FIGURE 7.
Quantification of (A) phenolic compounds (chlorogenic acid, ferulic acid, and scopoletin); (B) hormones and its derivatives (ABA, SA, SEG, SAG, JA, and JA-ILE), in mock and LD infiltrated areas at 3 dpi. (C) The inhibition of bacterial growth by SA and scopoletin on D. dadantii is expressed as percentage of bacterial growth. Error bars mean standard error, n = 5 (A,B), n = 9 (C). ∗P < 0.05; ∗∗P < 0.01; ∗∗∗P < 0.001.

