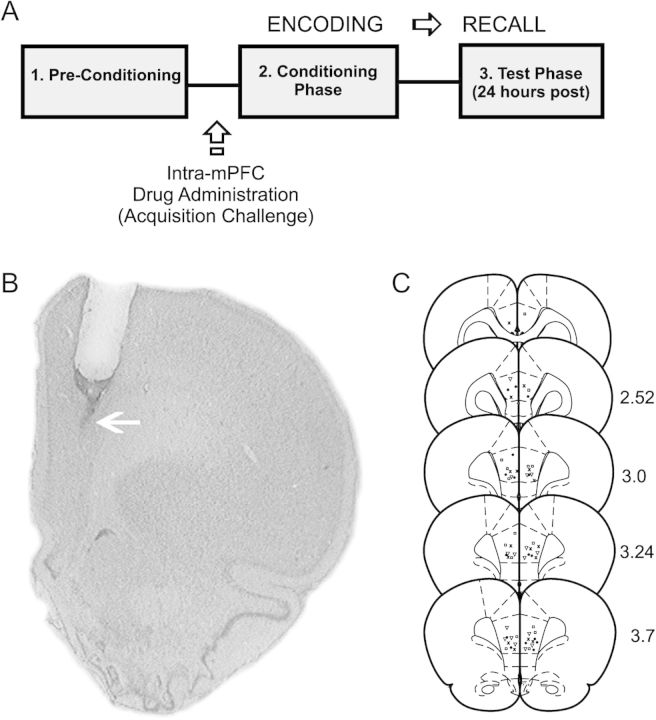
Figure 1.
Histological analysis of intra-mPFC microinjection sites and experimental protocol summary. (A) Microphotograph of a representative injector placement within the mPFC (white arrow represents injector tip location). (s) Schematic representation showing experimental associative fear conditioning assay and timeline for examining the acquisition (encoding) of associative olfactory fear memory. (C) Schematic illustration showing representative bilateral placements of microinjectors. For illustrative clarity, only a subset of experimental groups is presented. Symbols represent separate experimental groups; ▿, D4 agonist PD 168077; 50 ng/0.5 μL versus acquisition of subthreshold emotional stimuli; ×, D4 agonist PD 168077 50 ng/0.5 μL versus acquisition of supra-threshold emotional stimuli;  , Saline versus acquisition of subthreshold emotional stimuli; •, Saline versus acquisition of suprathreshold emotional stimuli.

