
Figure 3.
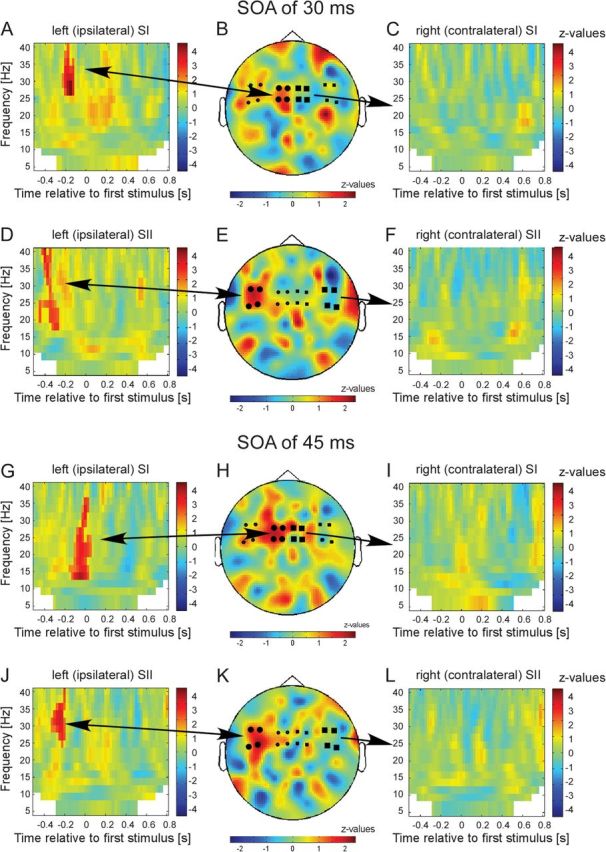
Results of the statistical comparison of trials with subjective simultaneity versus nonsimultaneity for conditions SOA 30 ms (A–F) and SOA 45 ms (G–L) for different sensor groups: (A) TFR for the 4 sensors over the left (ipsilateral) primary somatosensory cortex (SI) as indicated by the larger black circles in B. z values in nonsignificant pixels are lowered by 60% in order to highlight significant clusters. Color bars represent z values. Positive z values indicate higher power if subsequent stimulation was misperceived as simultaneously. (B) Topographical representation of the significant cluster as highlighted in A. Only time–frequency samples that correspond to the statistically significant time–frequency clusters in A were averaged to generate the topographical representation (for details, see Materials and Methods). (C) TFR for the 4 sensors over the right (contralateral) SI (as indicated by larger black squares). No significant clusters were found. (D) Same representation as in A but for 4 sensors over left (ipsilateral) secondary somatosensory cortex (SII). (E) Topographical representation for the significant cluster as highlighted in D. (F) TFR for the 4 sensors over the right (contralateral) SII (as indicated by larger black squares). (G–L) Same representation as in A–F but now for condition SOA of 45 ms.