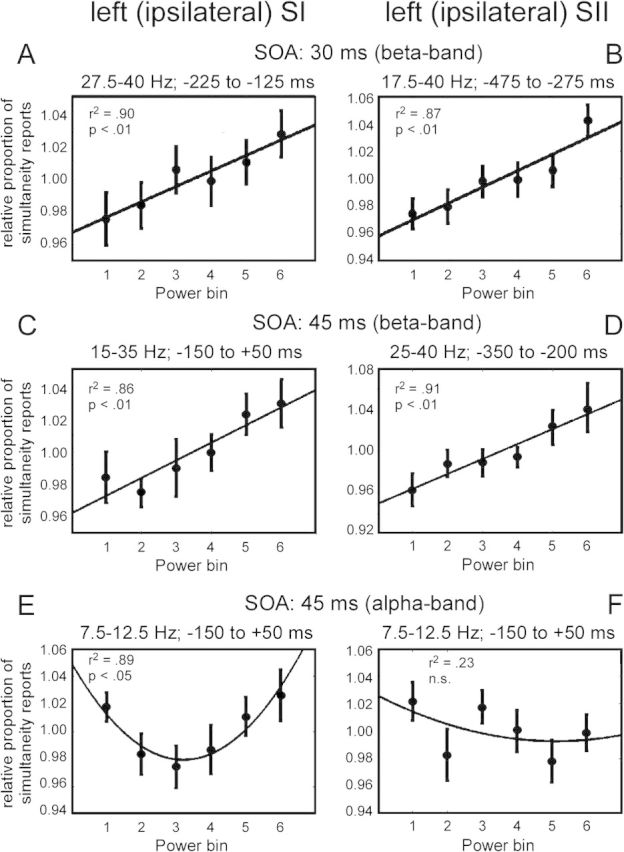
Figure 4.

Regression analyses of the dependence of subjective perception on prestimulus oscillatory activity for the 4 significant clusters in the beta band (as shown in Fig. 3) and for the alpha band. The exact time–frequency bands to determine averaged prestimulus power bins are based on significant clusters in Figure 3 and are presented at the top of each figure. (A) Results for the significant cluster in the beta band for condition SOA 30 ms in sensors over ipsilateral SI (as highlighted in Fig. 3A). (B) Same analysis as in A but for the significant cluster in sensors over SII (as highlighted in Fig. 3D). (C–D) Same analysis as in A,B but for the significant clusters in the beta band for condition SOA 45 ms (as highlighted in Fig. 3G,J). For all regression analyses, a significant linear relationship was found (P < 0.01). (E) Same analysis for the alpha band for condition SOA 45 ms in sensors over ipsilateral SI. A significant quadratic relationship was found. (F) Same analyses as in E but for sensors over SII. No significant relationship was found.
