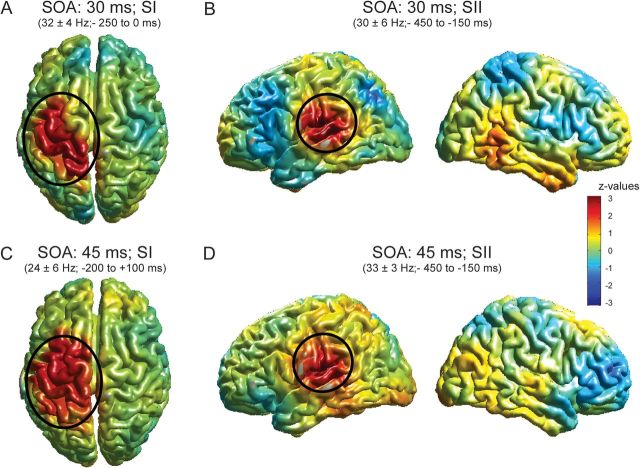
Figure 6.
Source analysis of significant clusters as found in Figure 3. The exact time–frequency bands used for source reconstruction are based on significant clusters in Figure 3 and are presented at the top of each figure. (A) Results for the significant cluster in the beta band for condition SOA 30 ms (as highlighted in Fig. 3A). z values in nonsignificant regions are lowered by 60% in order to highlight significant clusters. Additionally, significant clusters are highlighted by ovals. (B) Same as in A but for beta-band effect as highlighted in Figure 3D. Left column: view of the left hemisphere, right column: view of the right hemisphere. (C, D) Same as in A and B but for beta-band effect in SOA 45 ms (as highlighted in Fig. 3G,J). The color bar applies to all figures.

