
FIGURE 4.
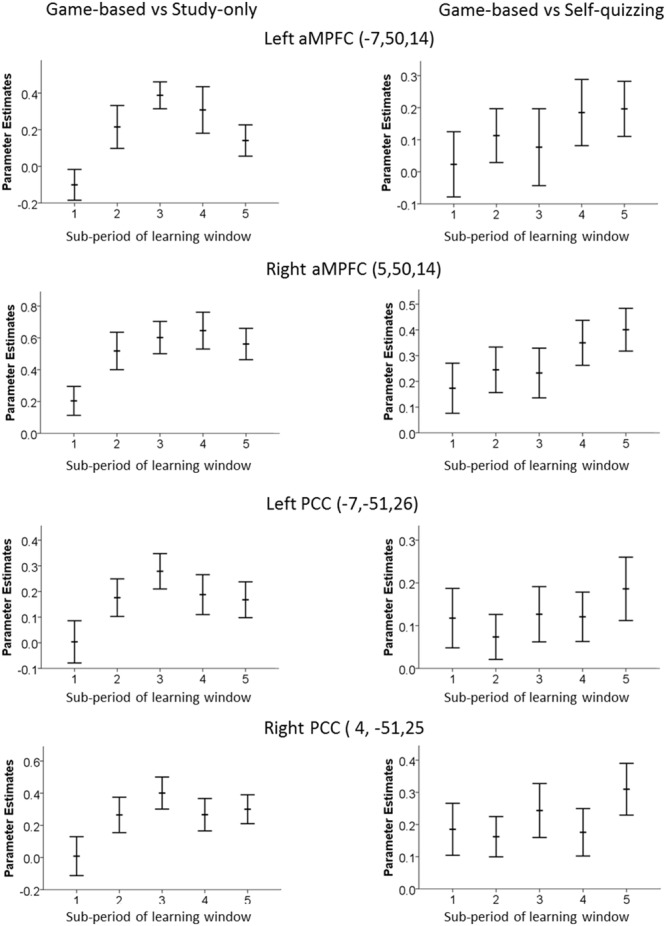
Time-variation of Default Mode Network ROI in the left and right aMPFC and PCC. Graphs were created by analyzing each 5.6 s sub-period of the 28 s learning window in the game-based condition and show the extent of decrease relative to (left) the Study-only condition and (right) the Self-quizzing condition. An increase in the parameters estimates plotted here represents greater deactivation.