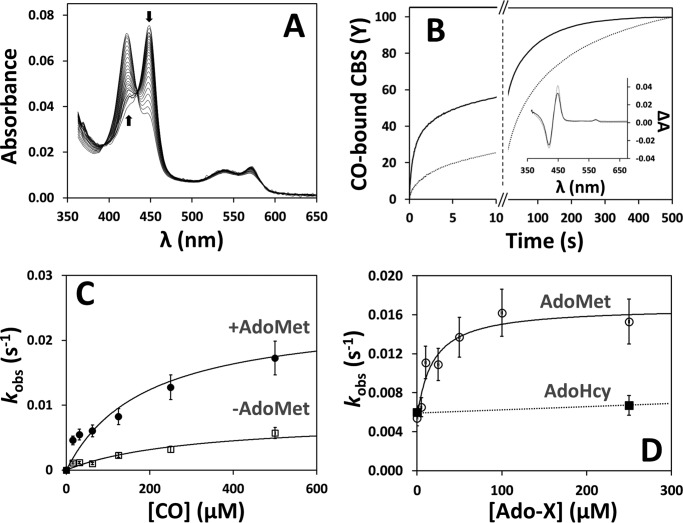
FIGURE 4.
AdoMet elicits faster CO binding to CBS. A, spectra collected over 500 s after stopped-flow mixing 1 mm CO with reduced CBS (1.5 μm in heme) at 25 °C in 50 mm potassium phosphate, 300 mm KCl, 10% glycerol, pH 7.0, containing 2 mm glucose, 4 units/ml glucose oxidase, 13 μg/ml catalase, and 6 units/ml SOD. Arrows depict the direction of absorption changes. B, reaction time courses measured in the absence (dotted line) or presence of AdoMet (500 μm before mixing; solid line). Fitted rate constants (% reaction amplitude) are as follows: k1 = 0.60 s−1 (40%) and k2 = 0.011 s−1 (60%) for AdoMet-bound CBS (t½ = 5.5 s) and k1 = 0.24 s−1 (20%) and k2 = 0.007 s−1 (80%) for AdoMet-free CBS (t1/2 = 55 s). As discussed in the text, k1 displayed a larger preparation-to-preparation variability compared with k2. Inset, optical transitions obtained by global fit analysis of the spectral data acquired in the absence (dotted line) or presence of AdoMet (solid line). C, CO concentration dependence of the observed rate constant (major kinetic phase) measured for CO binding to AdoMet-bound and AdoMet-free CBS ([AdoMet] = 500 μm before mixing). Data were fitted to a hyperbola yielding klim′ = 0.024 and 0.008 s−1 for AdoMet-bound and AdoMet-free CBS, respectively. D, observed rate constants (major kinetic phase) measured at 500 μm CO at the indicated AdoMet or AdoHcy concentration. Data for AdoMet were fitted to a hyperbola yielding C50 = 18.3 ± 2.7 μm AdoMet and klim′ = 0.017 s−1.

