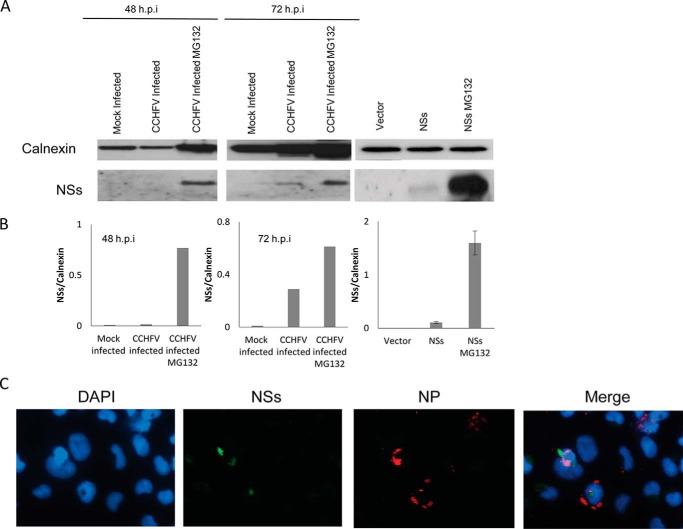
FIGURE 2.
NSs expression in CCHFV-infected or NSs-transfected cells. A, SW13 cells were mock-infected or infected with CCHFV and either left untreated or treated with MG132, followed by cell harvesting at 48 and 72 h.p.i. Alternatively, SW13 cells were transfected with empty vector or myc-NSs and either left untreated or treated with MG132, after which cells were harvested 24 h post-transfection. Western blot analysis was performed to determine the expression levels of CCHFV NSs (bottom row) and calnexin as a loading control (top row). The Western blots shown represent one of three independent experiments. B, densitometric analysis of NSs band intensities normalized to calnexin. C, immunofluorescence analysis was performed on CCHFV-infected cells. NSs (green) and nucleocapsid protein (NP, red) were analyzed by fluorescence microscopy. Nuclei were counterstained with DAPI (blue). Three independent experiments were performed, with a representative set of images shown here.

