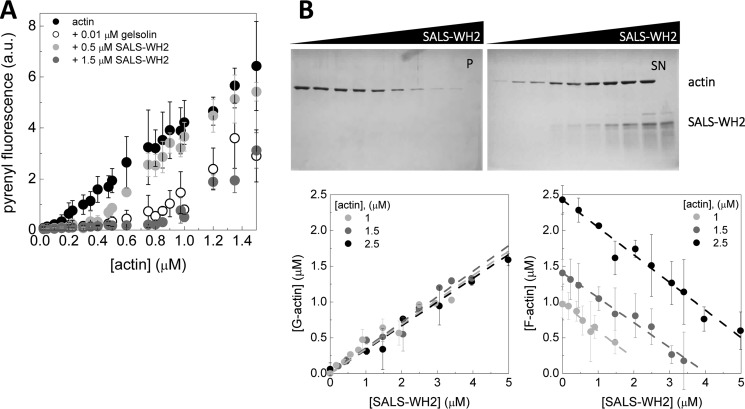
FIGURE 4.
SALS-WH2 sequesters actin monomers. A, critical concentration plots of actin assembly in the absence of any other protein and in the presence of gelsolin (0.01 μm) or SALS-WH2 (0.5 or 1.5 μm), as indicated. Error bars, standard deviation. a.u., arbitrary units. B, upper panel, representative Coomassie-stained gels of pellets (P) and supernatants (SN) from high speed sedimentation experiments. The actin concentration was 2.5 μm from lanes 1 to 9 and 0 μm in lane 10, the SALS-WH2 concentrations were 0, 1, 2, 2.8, 4.2, 5, 6, 9, and 12 μm from lanes 1–9 and 12 μm in lane 10. Lower panel, amount of G-actin and F-actin at steady-state as the function of the SALS-WH2 concentration derived from SDS-PAGE analysis. The actin concentrations were as follows: 1, 1.5, and 2.5 μm. Dashed lines in the corresponding colors show the linear fits to the data yielding average slope of |0.36| ± 0.02. Error bars, standard deviation.

