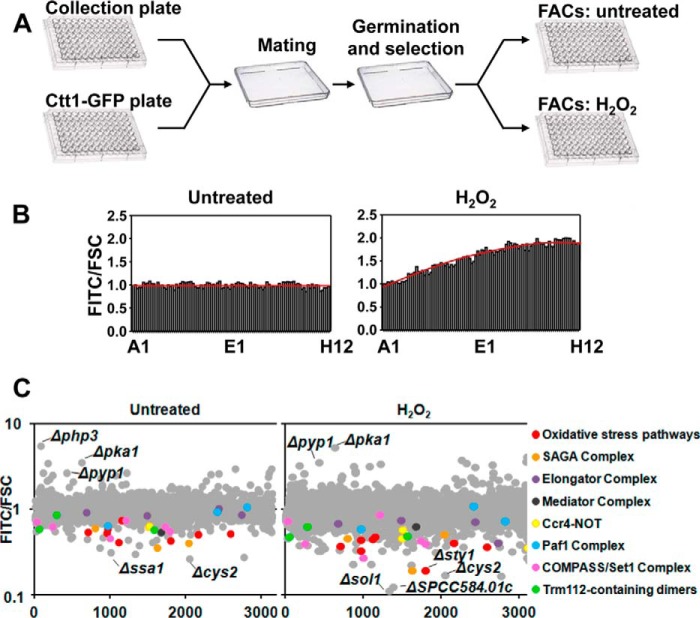
FIGURE 2.
Flow cytometry-based screening of a fission yeast deletion collection using fluorescence of Ctt1-GFP as a reporter. A, schematic representation of the construction and flow cytometry analysis of the Ctt1-GFP-expressing library of deletion strains. B, rich media cultures of strain PG102 (ctt1-GFP), either untreated or treated with 1 mm H2O2 for 60 min, were distributed in the 96 wells of a flow cytometry plate, and fluorescence along the complete plate was determined. Results are expressed as FITC/FCS ratio, normalized to the values at well number 1, with an assigned value of 1. A trend line is drawn in red. C, graphs show Ctt1-GFP FITC/FCS ratio corresponding to all deletion collection strains in a logarithmic scale, either untreated (left) or treated with 1 mm H2O2 for 60 min (right). Components of some complexes are differentially colored. The names of some deletion strains with the lowest or highest levels of Ctt1-GFP fluorescence are indicated.

