FIGURE 2.

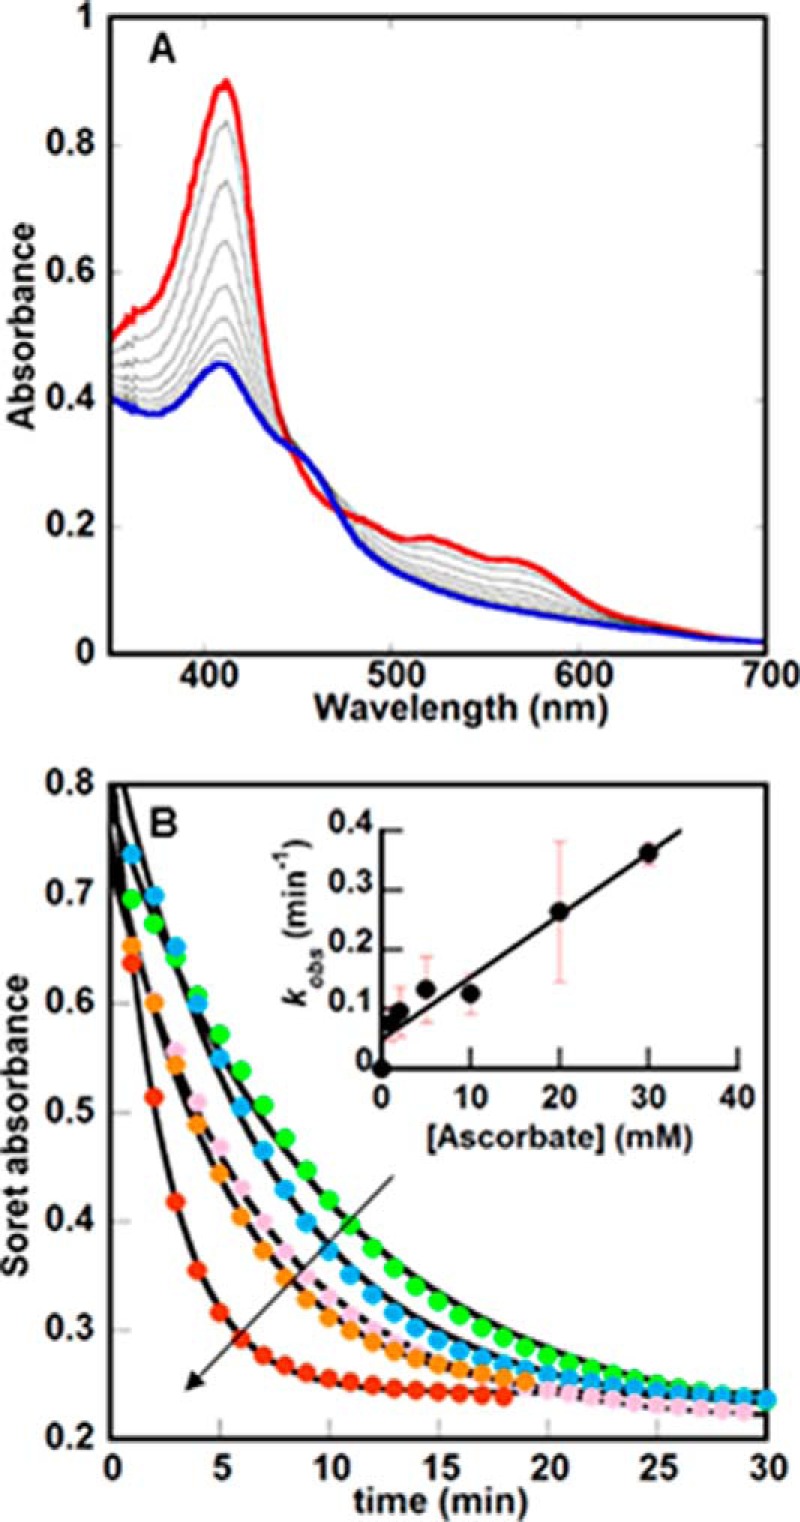
UV/visible spectroscopy illustrates broad changes to the IsdG-heme chromophore during the reaction with O2 and ascorbate. A, changes in the UV/vis spectrum of the heme bound to IsdG (10 μm) over time following the addition of 10 mm ascorbate (50 mm KPi, pH 7.4, 22 °C) are shown. 100 units of catalase are included in the reaction mixture to convert any unwanted H2O2 back to O2 and water. Spectra were measured every minute for 30 min; only spectra measured every 2 min from t = 0 (red) to t = 20 (blue) are shown. Notably, the final spectrum has maxima near 412 and 452 nm, similar to previously measured IsdG reactions but distinct from the UV/vis spectra for pure staphylobilins. (See Fig. 5A, below.) B, changes in the Soret band maximum (411 nm) versus time were plotted as a function of initial [ascorbate] (1, 5, 10, 20, and 30 mm), where the arrow indicates the direction of increasing [ascorbate]. Each curve was fit to a single exponential equation to obtain values for kobs, which in turn were used to determine the second-order rate constant k = 10 ± 0.1 m−1min−1 (inset).
